Question: ASSIGNMENT 3 CAPACITY PLANNING IN EXCEL 100 $ AS IS A B D E F G H J 1 Capacity Planning 2 3 FIXED COST:
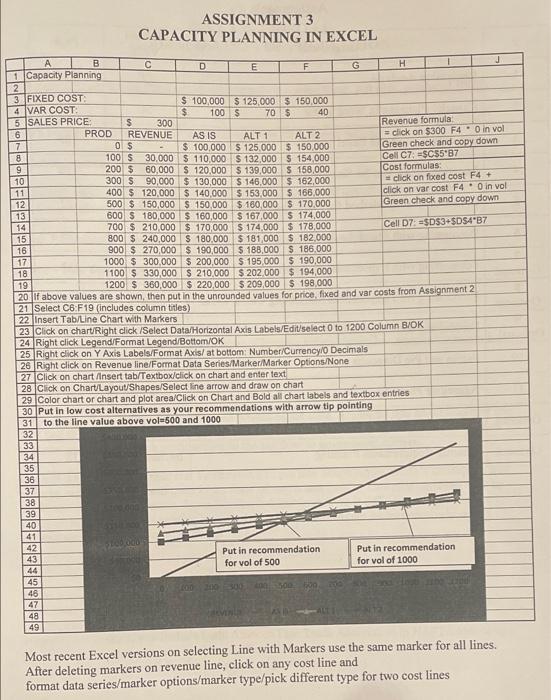
ASSIGNMENT 3 CAPACITY PLANNING IN EXCEL 100 $ AS IS A B D E F G H J 1 Capacity Planning 2 3 FIXED COST: $ 100,000 $125,000 3 150 000 4 VAR COST: $ 70 $ 40 5 SALES PRICE $ 300 Revenue formula 6 PROD REVENUE ALT 1 ALT 2 = click on $300 F40 in vol 7 0 $ $ 100,000 $ 125,000 $ 150,000 Green check and copy down 8 100 S 30.000 $ 110,000 S 132,000 S 154,000 Cell C7: $C$5*87 9 200 $ 60,000 S 120.000 $ 139,000 $ 158,000 Cost formulas 10 300 S 90,000 $ 130,000 $ 146,000 $ 162,000 click on foxed cost F4 + 11 400 $ 120,000 $ 140,000 $ 153,000 $ 166,000 click on var cost F4.0 in vol 12 500 $ 150,000 $ 150,000 $180,000 $ 170,000 Green check and copy down 13 600 $ 180,000 $ 160,000 $167,000 5 174,000 14 700 $ 210,000 $ 170,000 $ 174,000 $ 178,000 Cell D7: $D$3-$DS4B7 15 800 $ 240,000 $ 180,000 $ 181,000 $ 162,000 16 900 $ 270,000 $ 190,000 $ 188,000 $ 186.000 17 1000 $ 300,000 $ 200,000 $ 195,000 $ 190,000 18 1100 $ 330,000 $ 210.000 $ 202 000 $ 194,000 19 1200 S 360,000 $ 220,000 $ 209,000 S 198,000 20 if above values are shown, then put in the unrounded values for price, fixed and var costs from Assignment 2 21 Select C6:F19 (includes column titles) 22 insert Tab/Line Chart with Markers 23 Click on chart/Right click /Select Data/HorizontalAxis Labels/Edit/select oto 1200 Column B/OK 24 Right click Legend/Format Legend/Bottom/OK 25 Right click on Y Axis Labels/Format Axis/ at bottom: Number/Currency/o Decimals 26 Right click on Revenue line/Format Data Series/Marker/Marker Options:/None 27 Click on chart Ansert tab/Textbox/click on chart and enter text 28 Click on Chart Layout Shapes/Select line arrow and draw on chart 29 Color chart or chart and plot area/Click on Chart and Bold all chart labels and textbox entries 30 Put in low cost alternatives as your recommendations with arrow tip pointing 31 to the line value above vol=500 and 1000 32 33 34 35 36 37 38 39 40 41 42 43 Put in recommendation Put in recommendation 44 for vol of 500 for vol of 1000 45 48 47 48 49 Most recent Excel versions on selecting Line with Markers use the same marker for all lines. After deleting markers on revenue line, click on any cost line and format data series/marker options/marker type/pick different type for two cost lines