

Question: Assignment 3 (Chapter 5) 4. The graph below, illustrates the economy of Everton, which is presently in macroeconomic equilibrium. 130 LAS ( potential GDP )
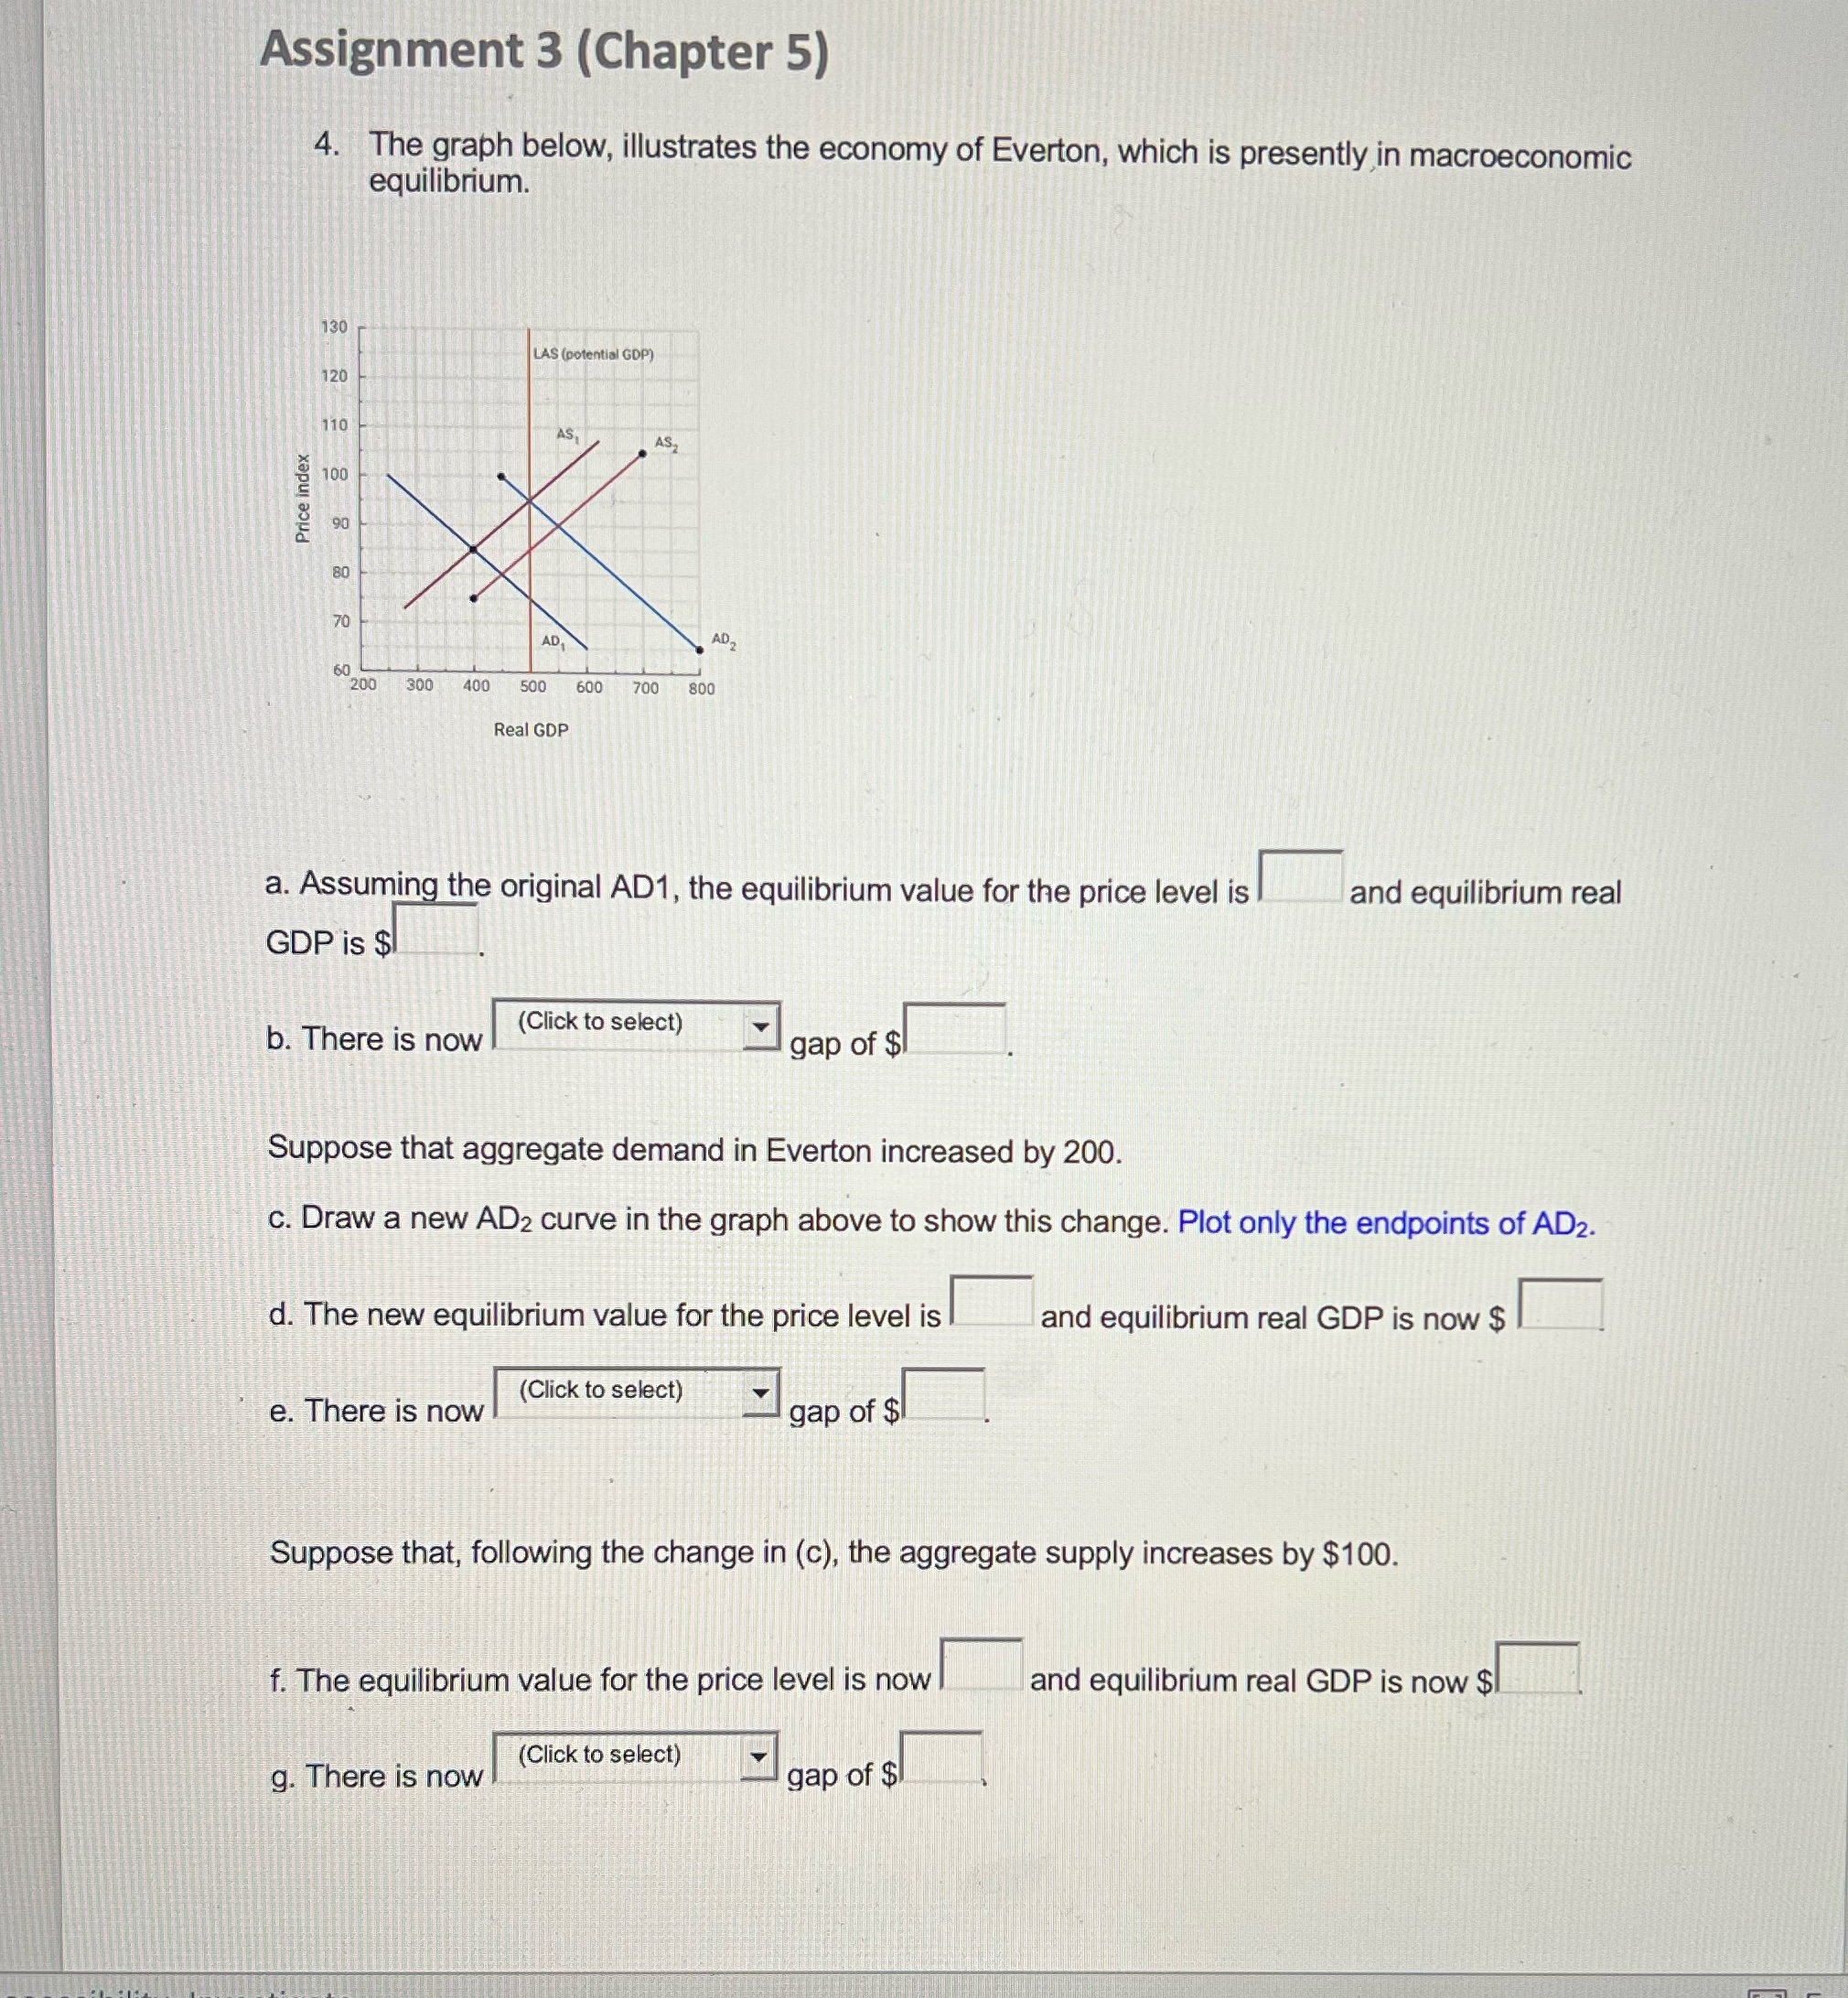
Assignment 3 (Chapter 5) 4. The graph below, illustrates the economy of Everton, which is presently in macroeconomic equilibrium. 130 LAS ( potential GDP ) 120 110 100 Price index 8 8 AD 2 200 300 400 500 600 800 Real GDP a. Assuming the original AD1, the equilibrium value for the price level is and equilibrium real GDP is $ b. There is now (Click to select) gap of $ Suppose that aggregate demand in Everton increased by 200. c. Draw a new AD2 curve in the graph above to show this change. Plot only the endpoints of AD2. d. The new equilibrium value for the price level is and equilibrium real GDP is now $ e. There is now | (Click to select) gap of $ Suppose that, following the change in (c), the aggregate supply increases by $100. . The equilibrium value for the price level is now and equilibrium real GDP is now $ g. There is now (Click to select) gap of $
Step by Step Solution
There are 3 Steps involved in it

Get step-by-step solutions from verified subject matter experts