

Question: Assignment 3 Data Month t Demand 1 574 - 2345678 1,004 717 1,076 1,076 932 1,291 1,219 9 932 10 1,219 11 1,219 21
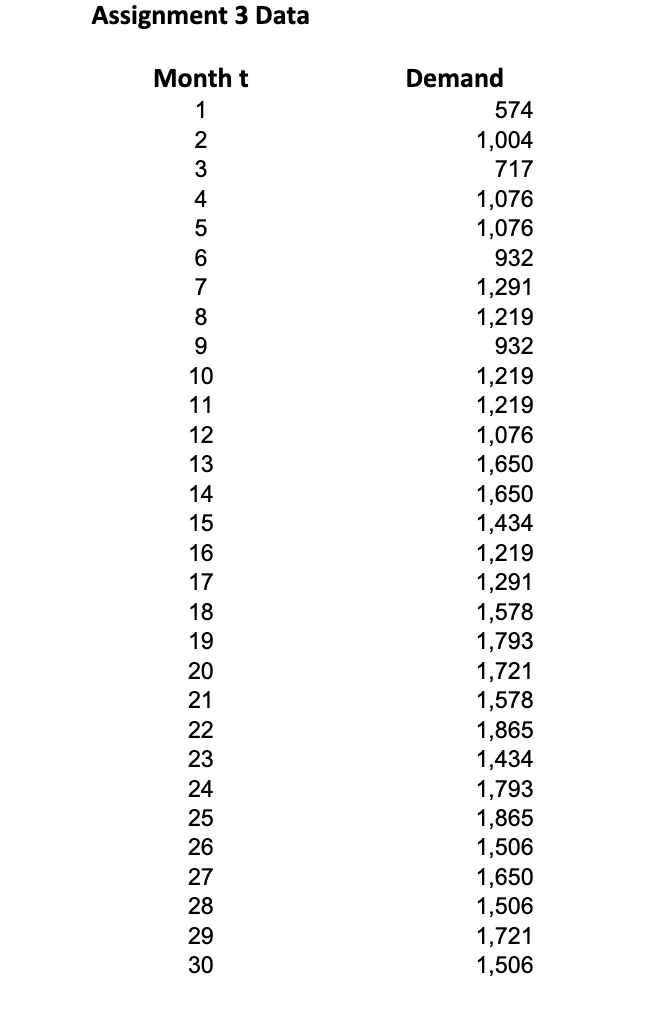
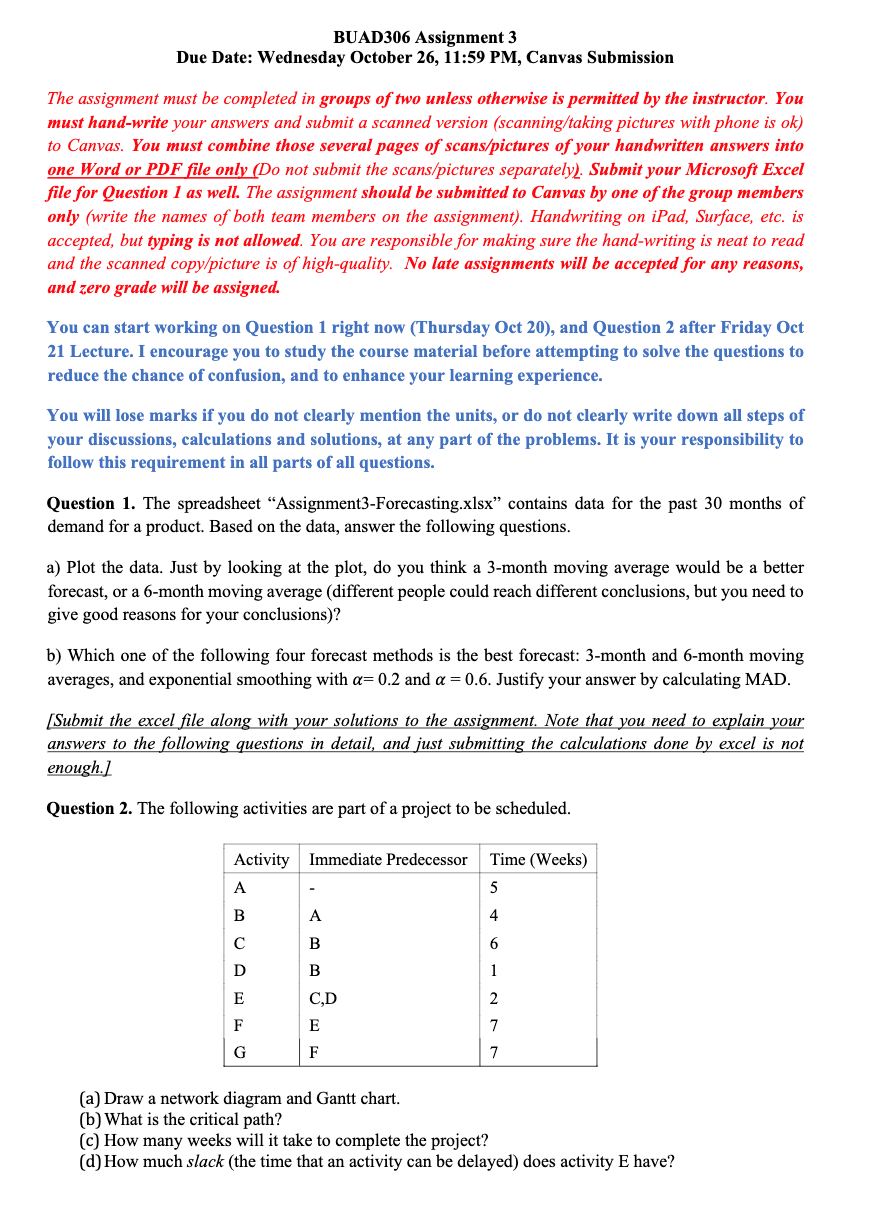
Assignment 3 Data Month t Demand 1 574 - 2345678 1,004 717 1,076 1,076 932 1,291 1,219 9 932 10 1,219 11 1,219 21 29 30 2345678222222222222 12 1,076 13 1,650 14 1,650 15 1,434 16 1,219 17 1,291 18 1,578 19 1,793 20 1,721 1,578 1,865 1,434 1,793 1,865 1,506 1,650 1,506 1,721 1,506 BUAD306 Assignment 3 Due Date: Wednesday October 26, 11:59 PM, Canvas Submission The assignment must be completed in groups of two unless otherwise is permitted by the instructor. You must hand-write your answers and submit a scanned version (scanning/taking pictures with phone is ok) to Canvas. You must combine those several pages of scans/pictures of your handwritten answers into one Word or PDF file only (Do not submit the scans/pictures separately). Submit your Microsoft Excel file for Question 1 as well. The assignment should be submitted to Canvas by one of the group members only (write the names of both team members on the assignment). Handwriting on iPad, Surface, etc. is accepted, but typing is not allowed. You are responsible for making sure the hand-writing is neat to read and the scanned copy/picture is of high-quality. No late assignments will be accepted for any reasons, and zero grade will be assigned. You can start working on Question 1 right now (Thursday Oct 20), and Question 2 after Friday Oct 21 Lecture. I encourage you to study the course material before attempting to solve the questions to reduce the chance of confusion, and to enhance your learning experience. You will lose marks if you do not clearly mention the units, or do not clearly write down all steps of your discussions, calculations and solutions, at any part of the problems. It is your responsibility to follow this requirement in all parts of all questions. Question 1. The spreadsheet "Assignment3-Forecasting.xlsx" contains data for the past 30 months of demand for a product. Based on the data, answer the following questions. a) Plot the data. Just by looking at the plot, do you think a 3-month moving average would be a better forecast, or a 6-month moving average (different people could reach different conclusions, but you need to give good reasons for your conclusions)? b) Which one of the following four forecast methods is the best forecast: 3-month and 6-month moving averages, and exponential smoothing with = 0.2 and a = 0.6. Justify your answer by calculating MAD. [Submit the excel file along with your solutions to the assignment. Note that you need to explain your answers to the following questions in detail, and just submitting the calculations done by excel is not enough.] Question 2. The following activities are part of a project to be scheduled. Activity Immediate Predecessor Time (Weeks) A 5 B A 4 B 6 B 1 E C,D 2 F E 7 G F 7 (a) Draw a network diagram and Gantt chart. (b) What is the critical path? (c) How many weeks will it take to complete the project? (d) How much slack (the time that an activity can be delayed) does activity E have?
Step by Step Solution
There are 3 Steps involved in it

Get step-by-step solutions from verified subject matter experts