

Question: ASSIGNMENT 3 Label Education Level Percentage A Less than High School 17 graduate B High school graduate 35 C Some college 16 D College graduate
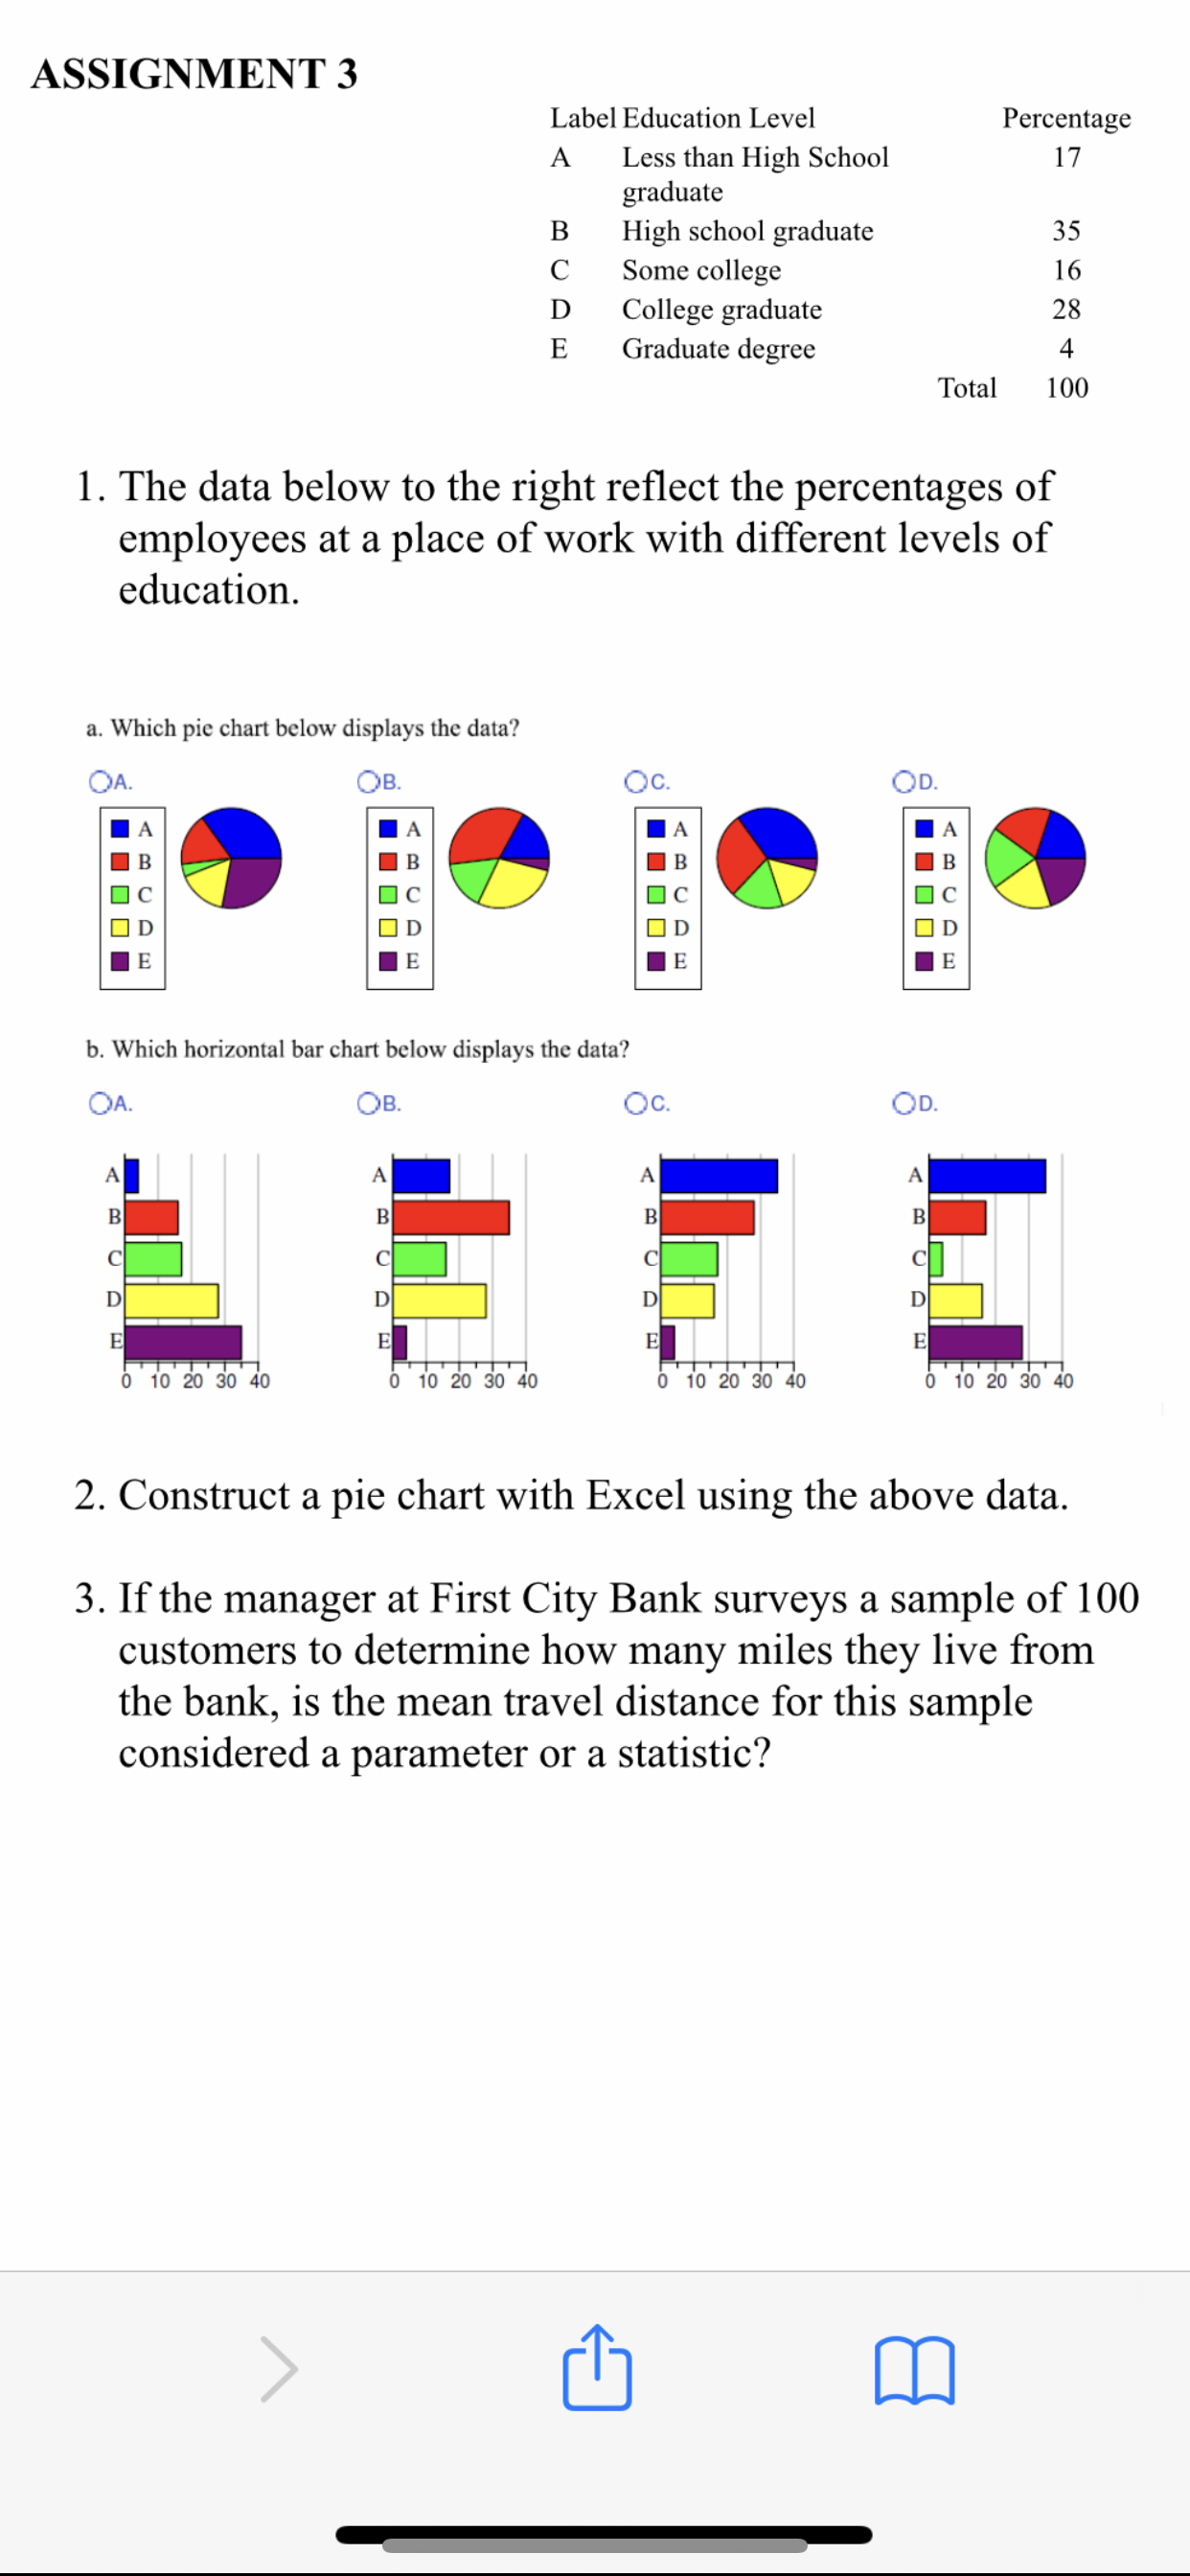
ASSIGNMENT 3 Label Education Level Percentage A Less than High School 17 graduate B High school graduate 35 C Some college 16 D College graduate 28 Graduate degree 4 Total 100 1. The data below to the right reflect the percentages of employees at a place of work with different levels of education. a. Which pie chart below displays the data? OA. OB. Oc. OD. I A A A A B B IB B C OD OD OD OD IE E E b. Which horizontal bar chart below displays the data? OA OB. Oc. OD. B D D D E E E 0 10 20 30 40 0 10 20 30 40 0 10 20 30 40 0 10 20 30 40 2. Construct a pie chart with Excel using the above data. 3. If the manager at First City Bank surveys a sample of 100 customers to determine how many miles they live from the bank, is the mean travel distance for this sample considered a parameter or a statistic
Step by Step Solution
There are 3 Steps involved in it

Get step-by-step solutions from verified subject matter experts