

Question: Assignment 3- To access data (use link below) https://drive.google.com/file/d/1Ztuu7PYBZH8DKIy_j_CzZcErOjrU0QF6/view?usp=sharing Questions: 1. Based on the scenario, what is the appropriate analysis for examining differences among the
Assignment 3- To access data (use link below)
https://drive.google.com/file/d/1Ztuu7PYBZH8DKIy_j_CzZcErOjrU0QF6/view?usp=sharing
Questions:
1. Based on the scenario, what is the appropriate analysis for examining differences among the Worth of Statistics subscale scores based on the number of online courses completed?
2. Write an appropriate null hypothesis for this analysis.
3. What is the mean Worth of Statistics score for each number of online courses completed?
4. What is the standard deviation for each number of online courses completed?
5. What is the observed or computed value of the test statistic comparing the Worth of Statistics subscale scores based on the number of online courses completed?
6. What are the reported degrees of freedom for the Between Groups variance?
7. What are the reported degrees of freedom for the Within Groups variance?
8. What is the reported level of significance?
9. Based on the results of the LSD post hoc test, which groups are significantly different?
10. Present the results as they might appear in an article. This must include narrative statement that reports and interprets the results of the analysis and LSD post hoc test.
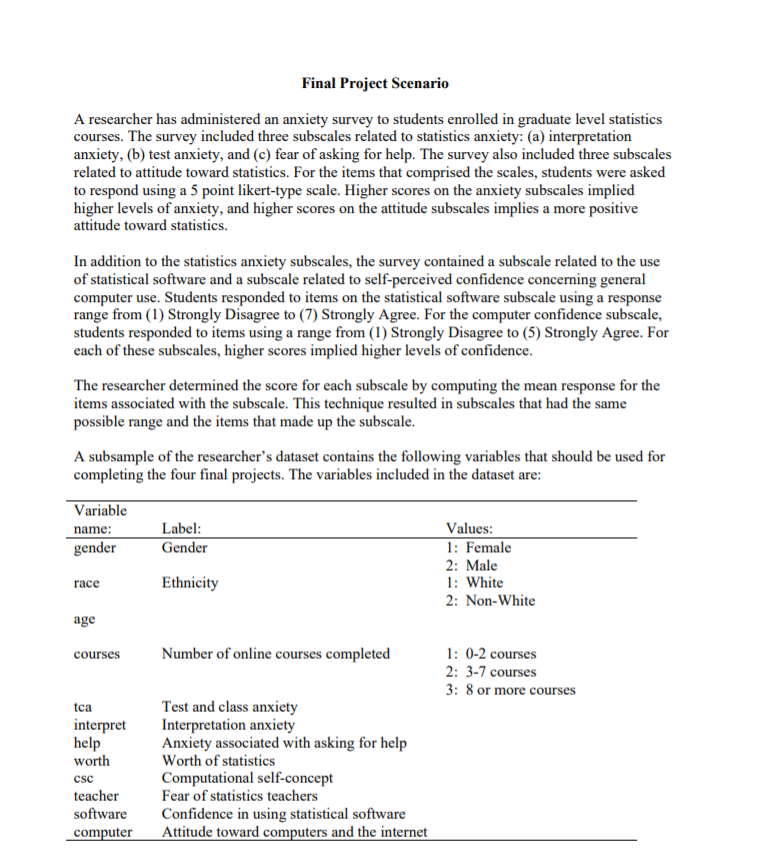
Final Project Scenario A researcher has administered an anxiety survey to students enrolled in graduate level statistics courses. The survey included three subscales related to statistics anxiety: (a) interpretation anxiety, (b) test anxiety, and (c) fear of asking for help. The survey also included three subscales related to attitude toward statistics. For the items that comprised the scales, students were asked to respond using a 5 point likert-type scale. Higher scores on the anxiety subscales implied higher levels of anxiety, and higher scores on the attitude subscales implies a more positive attitude toward statistics. In addition to the statistics anxiety subscales, the survey contained a subscale related to the use of statistical software and a subscale related to self-perceived confidence concerning general computer use. Students responded to items on the statistical software subscale using a response range from (1) Strongly Disagree to (7) Strongly Agree. For the computer confidence subscale, students responded to items using a range from (1) Strongly Disagree to (5) Strongly Agree. For each of these subscales, higher scores implied higher levels of confidence. The researcher determined the score for each subscale by computing the mean response for the items associated with the subscale. This technique resulted in subscales that had the same possible range and the items that made up the subscale. A subsample of the researcher's dataset contains the following variables that should be used for completing the four final projects. The variables included in the dataset are: Variable name: Label: Values: gender Gender 1: Female 2: Male race Ethnicity 1: White 2: Non-White age courses Number of online courses completed 1: 0-2 courses 2: 3-7 courses 3: 8 or more courses tca Test and class anxiety interpret Interpretation anxiety help Anxiety associated with asking for help worth Worth of statistics CSC Computational self-concept teacher Fear of statistics teachers software Confidence in using statistical software computer Attitude toward computers and the internet
Step by Step Solution
There are 3 Steps involved in it

Get step-by-step solutions from verified subject matter experts