

ASSETS ssi 6- Analysis of the Effects of Capitalizing Versus Expensing 04-19-2017 Exhibit 4 Liberator Medical...
Fantastic news! We've Found the answer you've been seeking!
Question:


Transcribed Image Text:
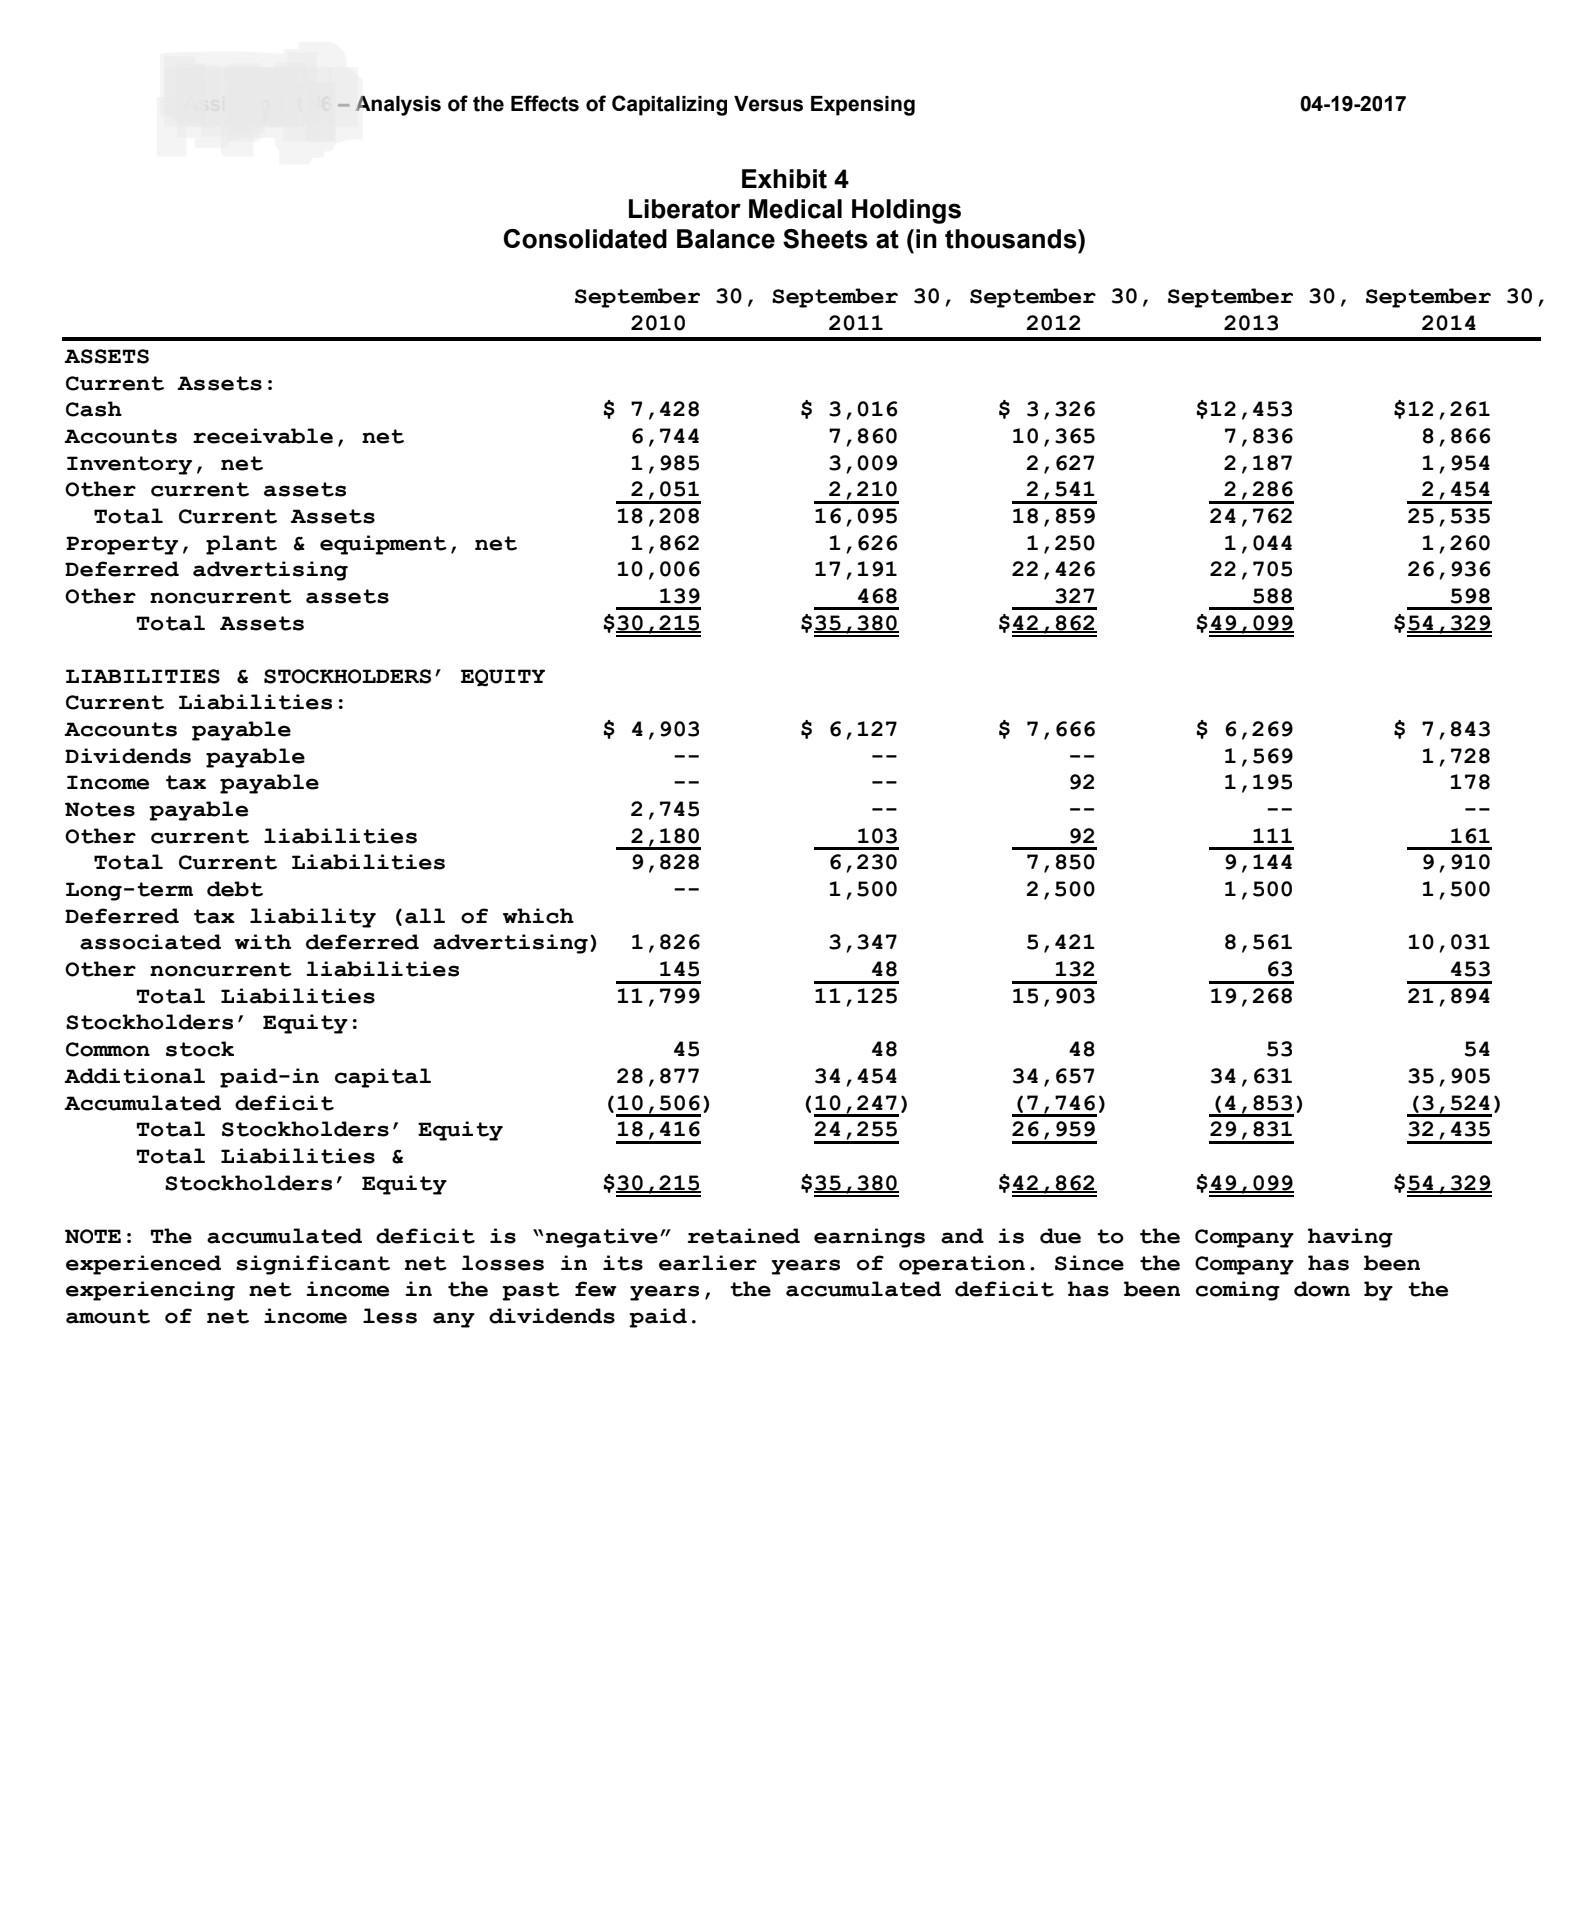
ASSETS ssi 6- Analysis of the Effects of Capitalizing Versus Expensing 04-19-2017 Exhibit 4 Liberator Medical Holdings Consolidated Balance Sheets at (in thousands) September 30, September 30, September 30, September 30, September 30, 2010 2011 2012 2013 2014 Current Assets: Cash $ 7,428 $ 3,016 $ 3,326 Accounts receivable, net 6,744 7,860 10,365 $12,453 7,836 $12,261 8,866 Inventory, net 1,985 3,009 2,627 2,187 1,954 Other current assets 2,051 2,210 2,541 2,286 2,454 Total Current Assets 18,208 16,095 18,859 24,762 25,535 Property, plant & equipment, net 1,862 1,626 1,250 1,044 Deferred advertising 10,006 17,191 22,426 22,705 Other noncurrent assets 139 468 Total Assets $30,215 $35,380 327 $42,862 588 $49,099 1,260 26,936 $54,329 598 LIABILITIES & STOCKHOLDERS' EQUITY Current Liabilities: Accounts payable $ 4,903 $ 6,127 $ 7,666 Dividends payable Income tax payable 92 $ 6,269 1,569 1,195 $ 7,843 1,728 178 Notes payable 2,745 -- Other current liabilities 2,180 103 92 111 161 Total Current Liabilities 9,828 6,230 7,850 9,144 9,910 Long-term debt 1,500 2,500 1,500 1,500 Deferred tax liability (all of which associated with deferred advertising) 1,826 3,347 5,421 8,561 10,031 Other noncurrent liabilities 145 48 132 63 Total Liabilities 11,799 11,125 15,903 19,268 453 21,894 Stockholders' Equity: Common stock 45 48 48 53 54 Additional paid-in capital 28,877 Accumulated deficit (10,506) 34,454 (10,247) 34,657 34,631 35,905 (7,746) (4,853) (3,524) Total Stockholders' Equity 18,416 24,255 26,959 29,831 32,435 Total Liabilities & Stockholders' Equity $30,215 $35,380 $42,862 $49,099 $54,329 NOTE: The accumulated deficit is "negative" retained earnings and is due to the Company having experienced significant net losses in its earlier years of operation. Since the Company has been experiencing net income in the past few years, the accumulated deficit has been coming down by the amount of net income less any dividends paid. 04-17-2017 Assignment #6 - Analysis of the Effects of Capitalizing Versus Expensing Exhibit 5 Liberator Medical Holdings Consolidated Statements of Operations For the years ended September 30, 2010, 2011, 2012, 2013 and 2014, (in thousands) September 30, September 30, September 30, September 30, September 30, 2010 2011 2012 2013 2014 Sales Cost of sales Gross profit Operating expenses: $40,919 $52,698 $60,943 $69,111 $74,569 14,349 20,601 23,924 25,689 27,808 26,570 32,097 37,019 43,422 46,761 Payroll, taxes and benefits 9,973 12,174 14,136 14,311 14,788 Amortized advertising costs 4,557 8,060 7,878 8,721 9,812 General and administrative 7,415 9,266 10,698 8,631 9,452 Total operating expenses Income from operations 21,945 29,500 32,712 31,663 34,052 4,625 2,597 4,307 11,759 12,709 Other income (expense) Income (loss) before income taxes Provision (credit) for income taxes Total provision (credit) for taxes Net Income (Loss) (1,927) (937) (75) (83) (50) 2,698 1,660 4,232 11,676 12,659 98 1,401 1,731 4,598 4,857 $ 2,600 $ 259 $ 2,501 $ 7,078 $ 7,802 Exhibit 6 Liberator Medical Holdings Consolidated Statements of Cash Flows - Operating Activities Only For the years ended September 30, 2010, 2011, 2012, 2013 and 2014, (in thousands) September 30, September 30, September 30, September 30, September 30, 2010 2011 2012 2014 Cash flow from operating activities Net Income (Loss) 2013 $ 2,600 $ 259 $ 2,501 $ 7,078 $ 7,802 Adjustments to reconcile net income (loss) to net cash provided by (used in) operating activities: Depreciation 593 730 794 Deferred income taxes 1,411 1,521 2,074 683 3,140 661 1,470 Amortization deferred advertising 4,557 8,060 7,878 8,721 9,812 Other items 3,925 5,110 4,698 3,790 3,783 Changes in operating assets and liabilities: Accounts receivable (5,988) (5,065) (7,293) Deferred advertising (10,808) (15,245) (13,113) (787) (9,000) (4,535) (14,043) Inventory Other assets (692) 70 (1,025) 216 368 255 49 143 40 (205) Accounts payable Other liabilities Net Cash Flows Provided by (Used in) Operating Activities (2,336) 2,002 (6) (4,494) 1,195 (83) 1,645 (89) (385) 552 (15) (24) (546) 13,633 5,528 9 EXHIBIT 7 - COMMON SIZE BALANCE SHEETS (as a percentage of Total Assets) September 30, September 30, September 30, September 30, September 30, 2010 2011 2012 2013 2014 ASSETS Current Assets: Cash Accounts receivable, net Inventory, net 24.6% 8.5% 7.8% 25.4% 22.6% 22.3% 22.2% 24.2% 16.0% 16.3% 6.6% 8.5% 6.1% 4.5% 3.6% Other current assets 6.8% 6.2% 5.9% 4.7% 4.5% Total Current Assets 60.3% 45.5% 44.0% 50.4% 47.0% Property, plant & equipment, net 6.2% 4.6% 2.9% 2.1% 2.3% Deferred advertising 33.1% 48.6% 52.3% 46.2% 49.6% Other noncurrent assets 0.5% 1.3% 0.8% 1.2% 1.1% Total Assets 100.0% 100.0% 100.0% 100.0% 100.0% LIABILITIES & STOCKHOLDERS' EQUITY Current Liabilities: Accounts payable 16.2% 17.3% 17.9% 12.8% 14.4% Dividends payable Income tax payable Notes payable Other current liabilities 0.0% 0.0% 0.0% 3.2% 3.2% 0.0% 0.0% 0.2% 2.4% 0.3% 9.1% 0.0% 0.0% 0.0% 0.0% 7.2% 0.3% 0.2% 0.2% 0.3% 32.5% 17.6% 18.3% 18.6% 18.2% 0.0% 4.2% 5.8% 3.1% 2.8% Total Current Liabilities Long-term debt Deferred tax liability (all of which associated with deferred advertising) 6.0% 9.5% 12.6% 17.4% 18.5% Other noncurrent liabilities 0.5% 0.1% 0.3% 0.1% 0.8% Total Liabilities 39.1% 31.4% 37.1% 39.2% 40.3% Stockholders' Equity: Common stock 0.1% 0.1% 0.1% 0.1% 0.1% Additional paid-in capital 95.6% 97.4% 80.9% 70.5% 66.1% Accumulated deficit -34.8% -29.0% -18.1% -9.9% -6.5% Total Stockholders' Equity 60.9% 68.6% 62.9% 60.8% 59.7% Total Liabilities & Stockholders' Equity 100.0% 100.0% 100.0% 100.0% 100.0% EXHIBIT 8 - COMMON SIZE INCOME STATEMENTS (As a percentage of Sales) Sales Cost of sales Gross profit Operating expenses: Payroll, taxes and benefits Amortized advertising costs General and administrative Total operating expenses September 30, September 30, September 30, September 30, September 30, 2010 2011 2012 2013 2014 100.0% 100.0% 100.0% 100.0% 100.0% 35.1% 39.1% 39.3% 37.2% 37.3% 64.9% 60.9% 60.7% 62.8% 62.7% 24.4% 23.1% 23.2% 20.7% 19.8% 11.1% 15.3% 12.9% 12.6% 13.2% 18.1% 17.6% 17.6% 18.7% 12.7% 53.6% 56.0% 53.7% 45.8% 45.7% Income from operations 11.3% 4.9% 7.1% 17.0% 17.0% Other income (expense) -4.7% -1.8% -0.1% -0.1% -0.1% Income (loss) before income taxes 6.6% 3.2% 6.9% 16.9% 17.0% Provision (credit) for income taxes 0.2% 2.7% 2.8% 6.7% 6.5% Net Income (Loss) 6.4% 0.5% 4.1% 10.2% 10.5% EXHIBIT 9 - RATIOS September 30, September 30, September 30, September 30, 2011 2012 2013 2014 Current ratio = current assets/current liabilities 2.58 2.40 2.71 2.58 Quick ratio (cash + receivables)/current liabilities 1.75 1.74 2.22 2.13 Inventory turnover = X = cost of goods sold/inventory Days inventory on hand = [(1/X)*365] 8.25 8.49 10.67 13.43 44 43 34 27 Receivables collection period = [(receivables/sales)*365] 51 55 48 41 Payables pay period = [(payables/cost of goods sold)*365] 98 105 99 93 Total interest-bearing debt/total assets 0.04 0.06 0.03 0.03 Long-term debt/(long-term debt + stockholders' equity) 0.06 0.08 0.05 0.04 Asset turnover = net sales/total assets 1.607 1.558 1.503 1.442 Profit margin = net income/net sales 0.5% 4.1% 10.2% 10.5% Return on assets = net income/total assets 0.8% 6.4% 15.4% 15.1% Leverage = total assets/stockholders' equity 1.46 1.59 1.65 1.68 Return on equity = net income/stockholders' equity 1.2% 9.8% 24.9% 25.1% ASSETS ssi 6- Analysis of the Effects of Capitalizing Versus Expensing 04-19-2017 Exhibit 4 Liberator Medical Holdings Consolidated Balance Sheets at (in thousands) September 30, September 30, September 30, September 30, September 30, 2010 2011 2012 2013 2014 Current Assets: Cash $ 7,428 $ 3,016 $ 3,326 Accounts receivable, net 6,744 7,860 10,365 $12,453 7,836 $12,261 8,866 Inventory, net 1,985 3,009 2,627 2,187 1,954 Other current assets 2,051 2,210 2,541 2,286 2,454 Total Current Assets 18,208 16,095 18,859 24,762 25,535 Property, plant & equipment, net 1,862 1,626 1,250 1,044 Deferred advertising 10,006 17,191 22,426 22,705 Other noncurrent assets 139 468 Total Assets $30,215 $35,380 327 $42,862 588 $49,099 1,260 26,936 $54,329 598 LIABILITIES & STOCKHOLDERS' EQUITY Current Liabilities: Accounts payable $ 4,903 $ 6,127 $ 7,666 Dividends payable Income tax payable 92 $ 6,269 1,569 1,195 $ 7,843 1,728 178 Notes payable 2,745 -- Other current liabilities 2,180 103 92 111 161 Total Current Liabilities 9,828 6,230 7,850 9,144 9,910 Long-term debt 1,500 2,500 1,500 1,500 Deferred tax liability (all of which associated with deferred advertising) 1,826 3,347 5,421 8,561 10,031 Other noncurrent liabilities 145 48 132 63 Total Liabilities 11,799 11,125 15,903 19,268 453 21,894 Stockholders' Equity: Common stock 45 48 48 53 54 Additional paid-in capital 28,877 Accumulated deficit (10,506) 34,454 (10,247) 34,657 34,631 35,905 (7,746) (4,853) (3,524) Total Stockholders' Equity 18,416 24,255 26,959 29,831 32,435 Total Liabilities & Stockholders' Equity $30,215 $35,380 $42,862 $49,099 $54,329 NOTE: The accumulated deficit is "negative" retained earnings and is due to the Company having experienced significant net losses in its earlier years of operation. Since the Company has been experiencing net income in the past few years, the accumulated deficit has been coming down by the amount of net income less any dividends paid. 04-17-2017 Assignment #6 - Analysis of the Effects of Capitalizing Versus Expensing Exhibit 5 Liberator Medical Holdings Consolidated Statements of Operations For the years ended September 30, 2010, 2011, 2012, 2013 and 2014, (in thousands) September 30, September 30, September 30, September 30, September 30, 2010 2011 2012 2013 2014 Sales Cost of sales Gross profit Operating expenses: $40,919 $52,698 $60,943 $69,111 $74,569 14,349 20,601 23,924 25,689 27,808 26,570 32,097 37,019 43,422 46,761 Payroll, taxes and benefits 9,973 12,174 14,136 14,311 14,788 Amortized advertising costs 4,557 8,060 7,878 8,721 9,812 General and administrative 7,415 9,266 10,698 8,631 9,452 Total operating expenses Income from operations 21,945 29,500 32,712 31,663 34,052 4,625 2,597 4,307 11,759 12,709 Other income (expense) Income (loss) before income taxes Provision (credit) for income taxes Total provision (credit) for taxes Net Income (Loss) (1,927) (937) (75) (83) (50) 2,698 1,660 4,232 11,676 12,659 98 1,401 1,731 4,598 4,857 $ 2,600 $ 259 $ 2,501 $ 7,078 $ 7,802 Exhibit 6 Liberator Medical Holdings Consolidated Statements of Cash Flows - Operating Activities Only For the years ended September 30, 2010, 2011, 2012, 2013 and 2014, (in thousands) September 30, September 30, September 30, September 30, September 30, 2010 2011 2012 2014 Cash flow from operating activities Net Income (Loss) 2013 $ 2,600 $ 259 $ 2,501 $ 7,078 $ 7,802 Adjustments to reconcile net income (loss) to net cash provided by (used in) operating activities: Depreciation 593 730 794 Deferred income taxes 1,411 1,521 2,074 683 3,140 661 1,470 Amortization deferred advertising 4,557 8,060 7,878 8,721 9,812 Other items 3,925 5,110 4,698 3,790 3,783 Changes in operating assets and liabilities: Accounts receivable (5,988) (5,065) (7,293) Deferred advertising (10,808) (15,245) (13,113) (787) (9,000) (4,535) (14,043) Inventory Other assets (692) 70 (1,025) 216 368 255 49 143 40 (205) Accounts payable Other liabilities Net Cash Flows Provided by (Used in) Operating Activities (2,336) 2,002 (6) (4,494) 1,195 (83) 1,645 (89) (385) 552 (15) (24) (546) 13,633 5,528 9 EXHIBIT 7 - COMMON SIZE BALANCE SHEETS (as a percentage of Total Assets) September 30, September 30, September 30, September 30, September 30, 2010 2011 2012 2013 2014 ASSETS Current Assets: Cash Accounts receivable, net Inventory, net 24.6% 8.5% 7.8% 25.4% 22.6% 22.3% 22.2% 24.2% 16.0% 16.3% 6.6% 8.5% 6.1% 4.5% 3.6% Other current assets 6.8% 6.2% 5.9% 4.7% 4.5% Total Current Assets 60.3% 45.5% 44.0% 50.4% 47.0% Property, plant & equipment, net 6.2% 4.6% 2.9% 2.1% 2.3% Deferred advertising 33.1% 48.6% 52.3% 46.2% 49.6% Other noncurrent assets 0.5% 1.3% 0.8% 1.2% 1.1% Total Assets 100.0% 100.0% 100.0% 100.0% 100.0% LIABILITIES & STOCKHOLDERS' EQUITY Current Liabilities: Accounts payable 16.2% 17.3% 17.9% 12.8% 14.4% Dividends payable Income tax payable Notes payable Other current liabilities 0.0% 0.0% 0.0% 3.2% 3.2% 0.0% 0.0% 0.2% 2.4% 0.3% 9.1% 0.0% 0.0% 0.0% 0.0% 7.2% 0.3% 0.2% 0.2% 0.3% 32.5% 17.6% 18.3% 18.6% 18.2% 0.0% 4.2% 5.8% 3.1% 2.8% Total Current Liabilities Long-term debt Deferred tax liability (all of which associated with deferred advertising) 6.0% 9.5% 12.6% 17.4% 18.5% Other noncurrent liabilities 0.5% 0.1% 0.3% 0.1% 0.8% Total Liabilities 39.1% 31.4% 37.1% 39.2% 40.3% Stockholders' Equity: Common stock 0.1% 0.1% 0.1% 0.1% 0.1% Additional paid-in capital 95.6% 97.4% 80.9% 70.5% 66.1% Accumulated deficit -34.8% -29.0% -18.1% -9.9% -6.5% Total Stockholders' Equity 60.9% 68.6% 62.9% 60.8% 59.7% Total Liabilities & Stockholders' Equity 100.0% 100.0% 100.0% 100.0% 100.0% EXHIBIT 8 - COMMON SIZE INCOME STATEMENTS (As a percentage of Sales) Sales Cost of sales Gross profit Operating expenses: Payroll, taxes and benefits Amortized advertising costs General and administrative Total operating expenses September 30, September 30, September 30, September 30, September 30, 2010 2011 2012 2013 2014 100.0% 100.0% 100.0% 100.0% 100.0% 35.1% 39.1% 39.3% 37.2% 37.3% 64.9% 60.9% 60.7% 62.8% 62.7% 24.4% 23.1% 23.2% 20.7% 19.8% 11.1% 15.3% 12.9% 12.6% 13.2% 18.1% 17.6% 17.6% 18.7% 12.7% 53.6% 56.0% 53.7% 45.8% 45.7% Income from operations 11.3% 4.9% 7.1% 17.0% 17.0% Other income (expense) -4.7% -1.8% -0.1% -0.1% -0.1% Income (loss) before income taxes 6.6% 3.2% 6.9% 16.9% 17.0% Provision (credit) for income taxes 0.2% 2.7% 2.8% 6.7% 6.5% Net Income (Loss) 6.4% 0.5% 4.1% 10.2% 10.5% EXHIBIT 9 - RATIOS September 30, September 30, September 30, September 30, 2011 2012 2013 2014 Current ratio = current assets/current liabilities 2.58 2.40 2.71 2.58 Quick ratio (cash + receivables)/current liabilities 1.75 1.74 2.22 2.13 Inventory turnover = X = cost of goods sold/inventory Days inventory on hand = [(1/X)*365] 8.25 8.49 10.67 13.43 44 43 34 27 Receivables collection period = [(receivables/sales)*365] 51 55 48 41 Payables pay period = [(payables/cost of goods sold)*365] 98 105 99 93 Total interest-bearing debt/total assets 0.04 0.06 0.03 0.03 Long-term debt/(long-term debt + stockholders' equity) 0.06 0.08 0.05 0.04 Asset turnover = net sales/total assets 1.607 1.558 1.503 1.442 Profit margin = net income/net sales 0.5% 4.1% 10.2% 10.5% Return on assets = net income/total assets 0.8% 6.4% 15.4% 15.1% Leverage = total assets/stockholders' equity 1.46 1.59 1.65 1.68 Return on equity = net income/stockholders' equity 1.2% 9.8% 24.9% 25.1%
Expert Answer:
Answer rating: 100% (QA)
Based on the financial statements provided here is my analysis of the effects of capitalizing versus ... View the full answer

Related Book For 
Intermediate Accounting Reporting and Analysis
ISBN: 978-1285453828
2nd edition
Authors: James M. Wahlen, Jefferson P. Jones, Donald Pagach
Posted Date:
Students also viewed these accounting questions
-
List three specific parts of the Case Guide, Objectives and Strategy Section (See below) that you had the most difficulty understanding. Describe your current understanding of these parts. Provide...
-
Ari Goldstein issued $300,000 of 11%, five-year bonds payable on January 1, 2024. The market interest rate at the date of issuance was 10%, and the bonds pay interest semiannually. Requirements 1....
-
Recruiting people for jobs that require international assignments is increasingly important for many organizations. Where might an organization go to recruit people interested in such assignments?
-
The lesser-weighted events like Christmas, or a change in eating habits, seem to fit within the category of short, manageable disruptions to routines. The actual impact of these events will vary...
-
I spent time with you. It seems that this deed is out of character for you. You were not awarded your normal annual bonus. I would probably feel the same. Is that what happened? You normally wouldnt...
-
Conte Chemical Co. uses the weighted average cost method. All materials are added at the start of the production process. Labor and overhead are added evenly at the same rate throughout the process....
-
Pioneer Inc. wants to invest $557,302 today. The expected returns in years 1, 2, and 3 are $247,615, $180,383, and $335,481, respectively. If the rate of return on investment must be at least 14%,...
-
The balance of Mr. Richie's account in Gables Capital, a hedge fund, is now $1,540,000. The history of his investment with the fund is as follows. Three years ago, Mr. Richie opened the account and...
-
Saad Company uses a standard cost accounting system. During March, 2014, the company reported the following manufacturing variances: In addition, 15,000 units of product were sold at $18 per unit....
-
Nikora Ltd., based in Georgia, produces meat and milk products. The company sold old machinery for 100,000 Georgian Lari (GEL) and decided to put this amount in a term deposit, which usually pays 10...
-
If the ratio of the percent change in earnings per share to the corresponding percent change in EBIT were 2, what percent change in earnings would you expect to follow a 15 percent decline in EBIT?
-
Glass Doctor Company manufactures sunglasses. Following is a list of costs the company incurred during May. Use the list to calculate the total manufacturing overhead costs for the month. Glue for...
-
Al Nada Company provides insurance for vehicles. In December, the company earned $30,000 in revenues and incurred the following operating costs to insure 100 vehicles: Requirements 1. What is Al...
-
Cosmos Sdn Bhd, financial year ends on 31 December annually is a supplier of fresh flowers in Malaysia. For the year of assessment 2020, the estimated income tax payable made by the company amounted...
-
Carlton Stokes owns and operates a car-detailing business named SuperShine & Detailing. For $150, Carltons business will hand wash and wax customers cars, vacuum the interior, and thoroughly clean...
-
Explain why companies sometimes recognize accruals for accrued expenses and accrued revenues. Give an example of an adjusting entry to record each of these items.
-
Use the information in RE20-2. Prepare the journal entries that Richie Company (the lessor) would make in the year of the lease assuming the lease is classified as a sales-type lease. Assume that the...
-
The following is information about three different companies. 1. Noon Wake up Company is a software game development company that creates titles for the Android operating system. The company recently...
-
Which strategy for entering a new international market should (a) an architectural design firm, (b) an online discount broker, and (c) a satellite TV channel consider, and why?
-
How can a firm design perceived control into a service encounter? Apply it to one face-to-face and one online encounter.
-
Give examples of how Internet and telecommunications technologies (e.g., mobile commerce [M-Commerce] and apps) have changed some of the services you use.

Study smarter with the SolutionInn App