

Question: Assignment #6: Testing Correlations Directions: Use the Bivariate Correlation function and the Options submenu to answer each of the questions based on the above scenario.
Assignment #6: Testing Correlations
Directions: Use the Bivariate Correlation function and the Options submenu to answer each of the questions based on the above scenario. The superintendent has continued the examination of data by examining the relationship between attendance rate and percent of students eligible for free or reduced priced lunch. The district data used for the analysis are contained below.
1.What is the mean percent of students receiving free or reduced lunch? What is the mean attendance rate?
2.What are the standard deviations for the percent of students receiving free or reduced lunch and attendance rate?
3.State an appropriate null hypothesis for this analysis.
4.What is the value of the correlation coefficient?
5.Based on the value of the correlation coefficient, how would you classify the strength of this relationship?
6.Based on the information from the scenario, what is the appropriate value for the degrees of freedom?
7.What is the reported level of significance?
8.Present the results as they might appear in an article. This must include a narrative statement that reports and interprets the results of the correlation analysis.
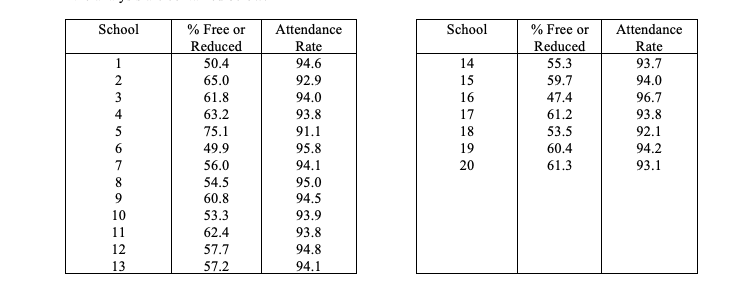
School % Free or Attendance School Free or Attendance Reduced Rate Reduced Rate 65 500 10 UAWNE 50.4 94.6 14 55.3 93.7 65.0 92.9 15 59.7 94.0 61.8 94.0 16 47.4 96.7 63.2 93.8 17 61.2 93.8 75.1 91.1 18 53.5 92.1 49.9 95.8 19 60.4 94.2 56.0 94.1 20 61.3 93.1 54.5 95.0 60.8 94.5 53.3 93.9 62.4 93.8 57.7 94.8 13 57.2 94.1
Step by Step Solution
There are 3 Steps involved in it

Get step-by-step solutions from verified subject matter experts