

Question: ASSIGNMENT 8 (Regression and Correlation Analysis) The table below shows the daily income and food expenditure for 7 households. Income (RM) 35 49 21 39
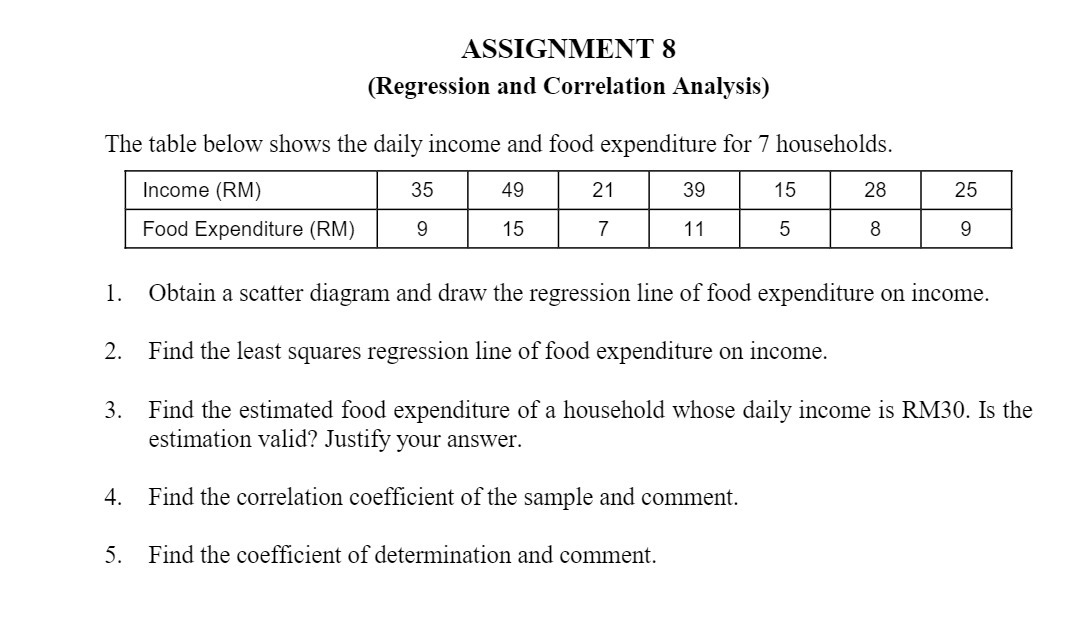
ASSIGNMENT 8 (Regression and Correlation Analysis) The table below shows the daily income and food expenditure for 7 households. Income (RM) 35 49 21 39 15 28 25 Food Expenditure (RM) 9 15 7 11 5 8 9 1. Obtain a scatter diagram and draw the regression line of food expenditure on income. 2. Find the least squares regression line of food expenditure on income. 3. Find the estimated food expenditure of a household whose daily income is RM30. Is the estimation valid? Justify your answer. 4. Find the correlation coefficient of the sample and comment. 5. Find the coefficient of determination and comment
Step by Step Solution
There are 3 Steps involved in it
1 Expert Approved Answer
Step: 1 Unlock

Question Has Been Solved by an Expert!
Get step-by-step solutions from verified subject matter experts
Step: 2 Unlock
Step: 3 Unlock