

Question: ASSIGNMENT A . Passive cooling strategies Fig 1 2 . 2 attached as page 3 . Carefully plot the given NOAA data, temperature and relative
ASSIGNMENT
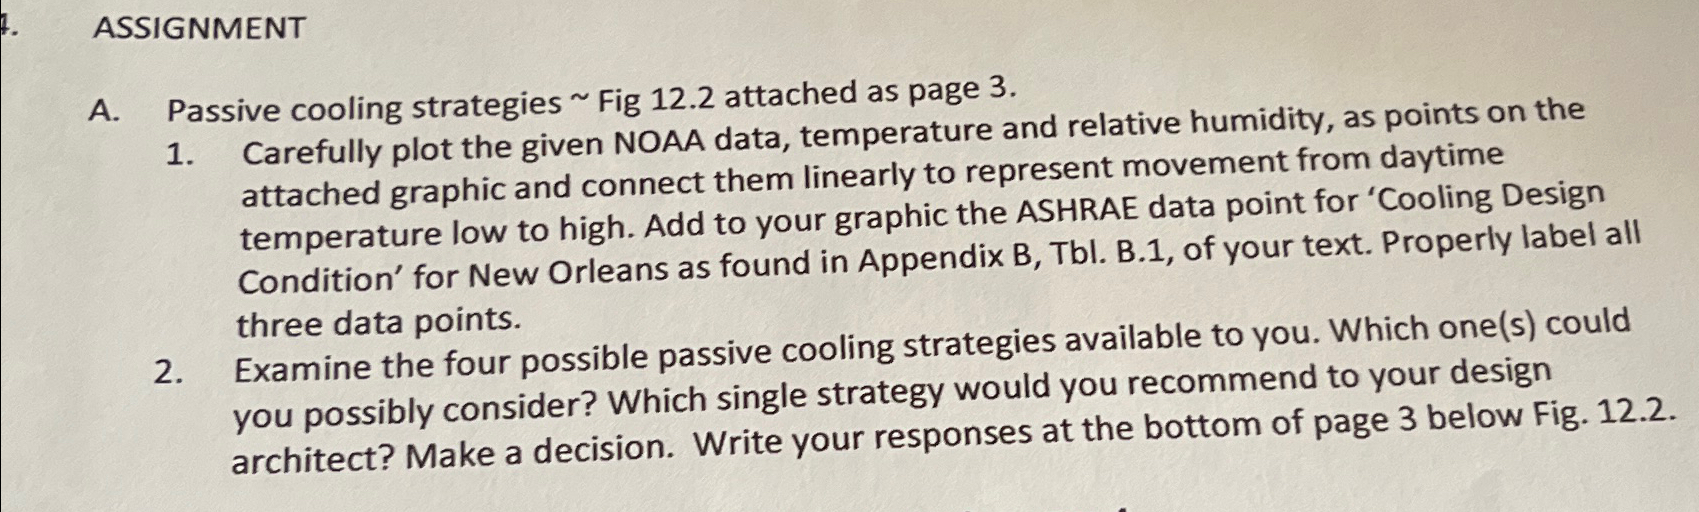
A Passive cooling strategies Fig attached as page
Carefully plot the given NOAA data, temperature and relative humidity, as points on the attached graphic and connect them linearly to represent movement from daytime temperature low to high. Add to your graphic the ASHRAE data point for 'Cooling Design Condition' for New Orleans as found in Appendix B TbI. B of your text. Properly label all three data points.
Examine the four possible passive cooling strategies available to you. Which ones could you possibly consider? Which single strategy would you recommend to your design architect? Make a decision. Write your responses at the bottom of page below Fig.
Step by Step Solution
There are 3 Steps involved in it
1 Expert Approved Answer
Step: 1 Unlock

Question Has Been Solved by an Expert!
Get step-by-step solutions from verified subject matter experts
Step: 2 Unlock
Step: 3 Unlock