

Question: Assignment: a. what is the shape of each distribution based on visual inspection of the graphs? b. what conclusion can you draw about the symmetry
Assignment:
a. what is the shape of each distribution based on visual inspection of the graphs?
b. what conclusion can you draw about the symmetry of these distribution by comparing the size of the central tendency measures and examining the graphs for these variables? Explain the reasons for your answer.
I'll share the two histograms and the table needed for this. Just answer the questions clearly and effictively. Using the images provided.
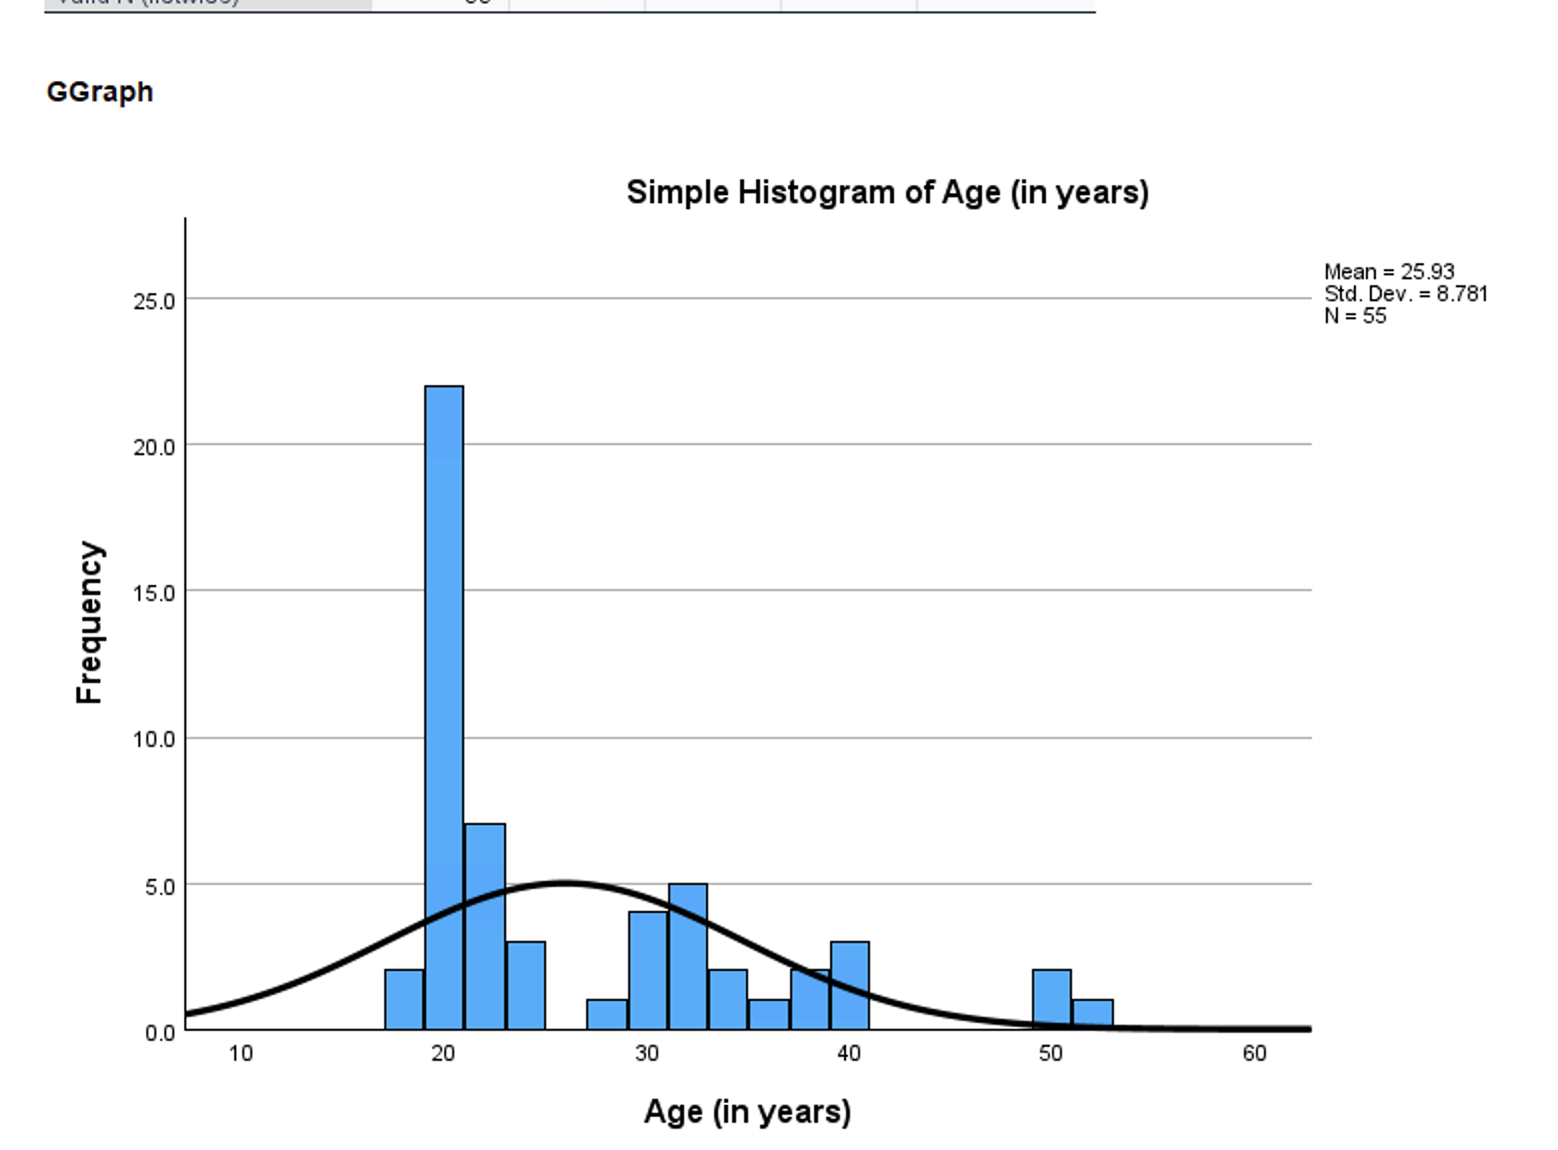
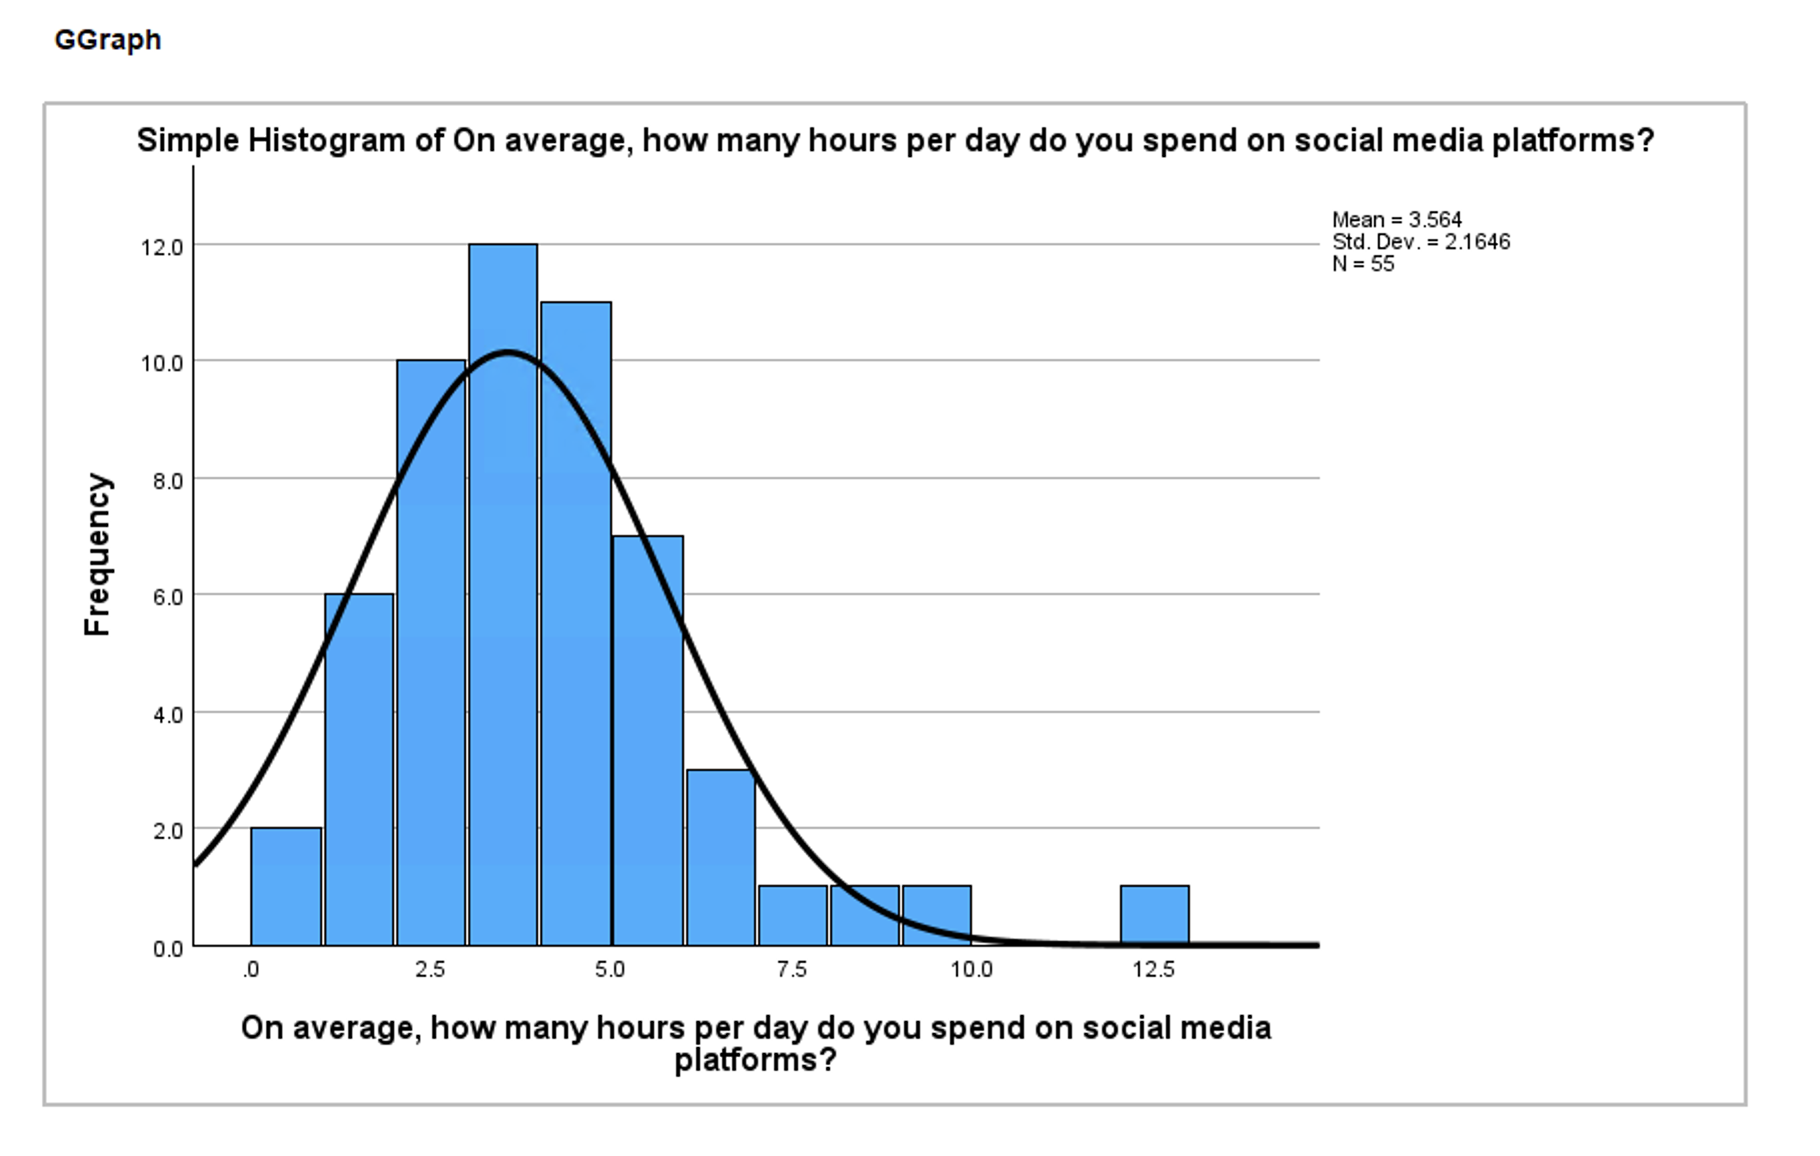
GGraph Simple Histogram of Age (in years) Mean = 25.93 25.0 Std. Dev. = 8.781 N = 55 20.0 15.0 Frequency 10.0 5.0 0.0 10 20 30 40 50 60 Age (in years)GGraph Simple Histogram of On average, how many hours per day do you spend on social media platforms? Mean = 3.564 Std. Dev. = 2.1646 N=55 > o c o 3 o [ e '8 0 25 50 75 10.0 125 On average, how many hours per day do you spend on social media platforms
Step by Step Solution
There are 3 Steps involved in it

Get step-by-step solutions from verified subject matter experts