

Question: Assignment Content This assignment has two parts. Complete both parts of the assignment. Once completed, click on the view/complete link to submit to the
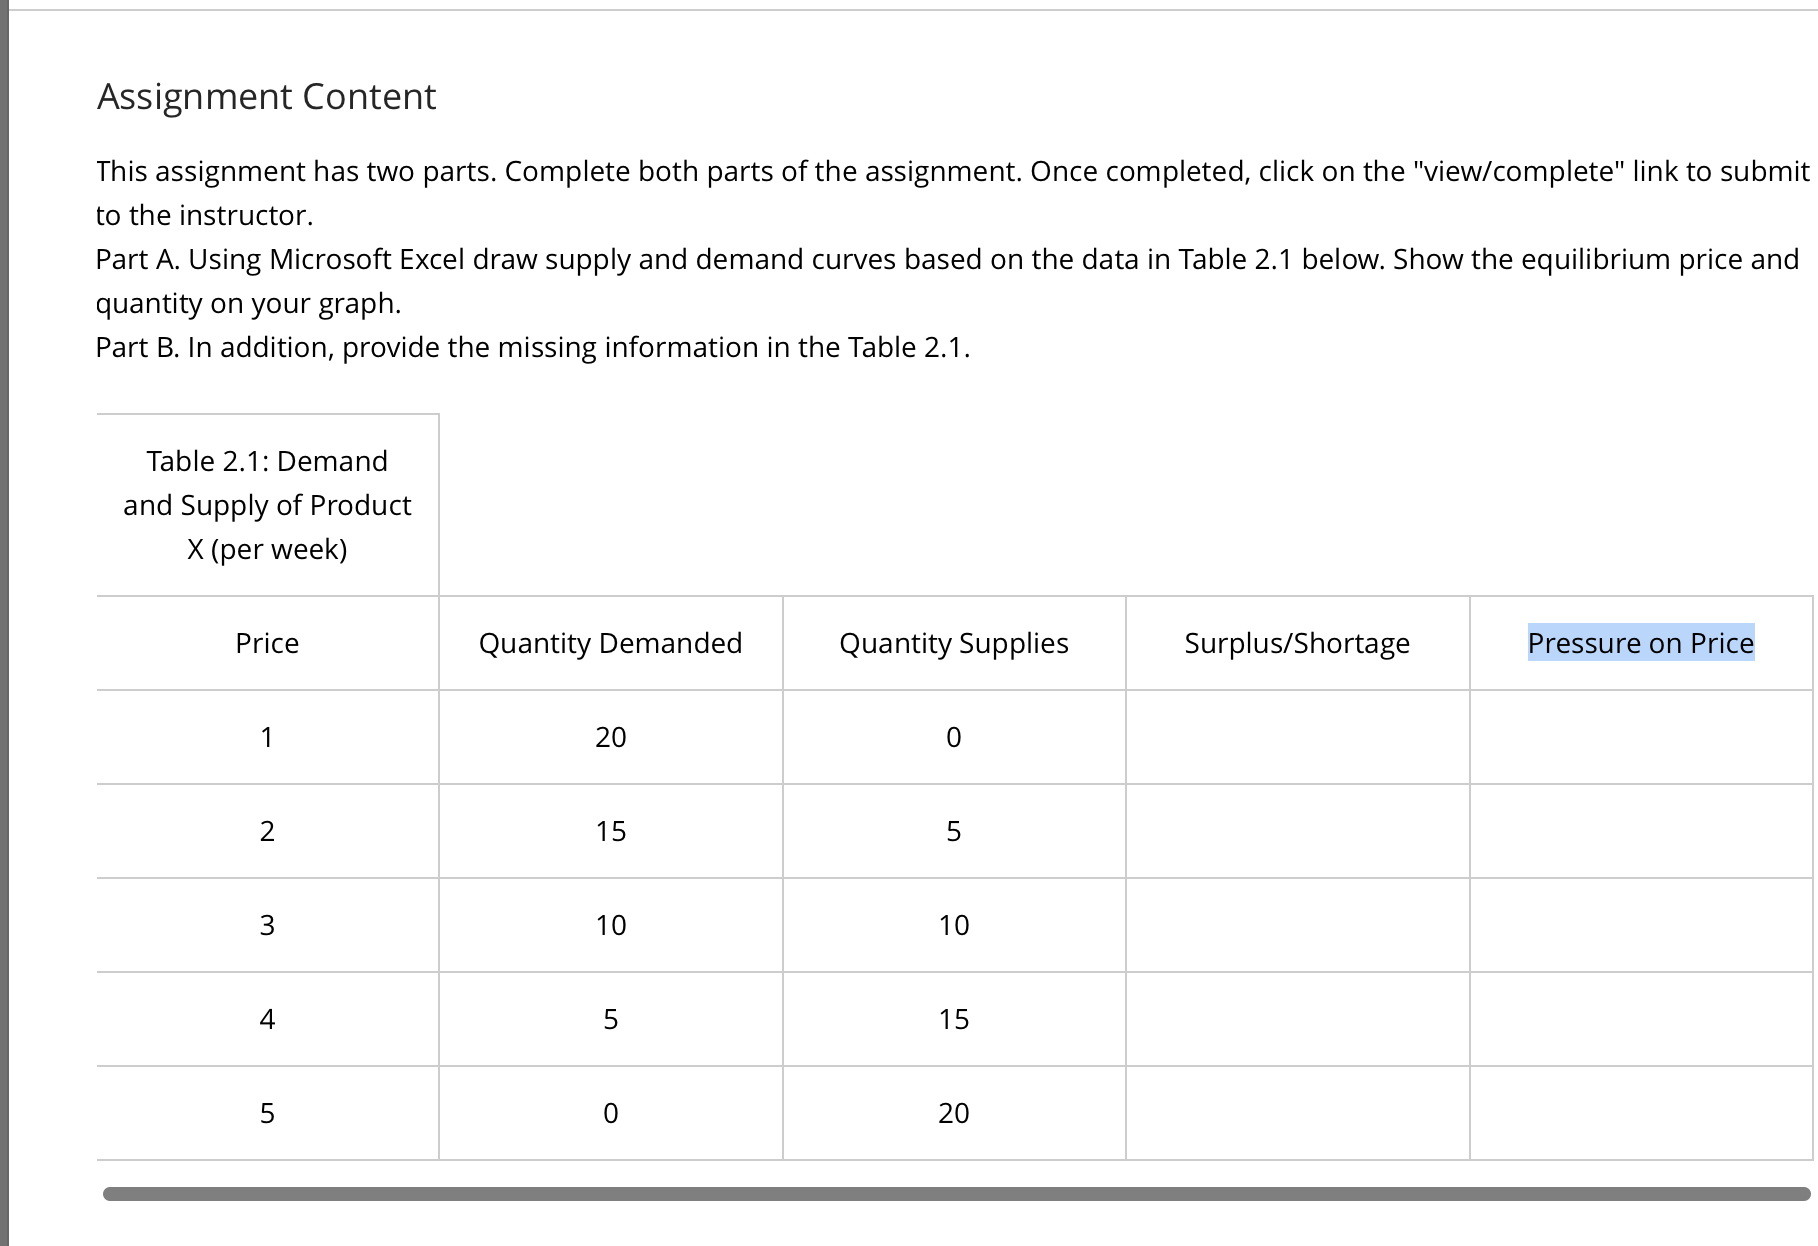
Assignment Content This assignment has two parts. Complete both parts of the assignment. Once completed, click on the "view/complete" link to submit to the instructor. Part A. Using Microsoft Excel draw supply and demand curves based on the data in Table 2.1 below. Show the equilibrium price and quantity on your graph. Part B. In addition, provide the missing information in the Table 2.1. Table 2.1: Demand and Supply of Product X (per week) Price 1 Quantity Demanded Quantity Supplies Surplus/Shortage Pressure on Price 20 2 15 5 3 10 10 4 5 5 0 15 20 20
Step by Step Solution
There are 3 Steps involved in it
1 Expert Approved Answer
Step: 1 Unlock

Question Has Been Solved by an Expert!
Get step-by-step solutions from verified subject matter experts
Step: 2 Unlock
Step: 3 Unlock