

Question: Assignment: Create an excel spreadsheet similar to Figure 4.2 on page 74 in the Lean Production Simplified book. Use formulas in your table so that
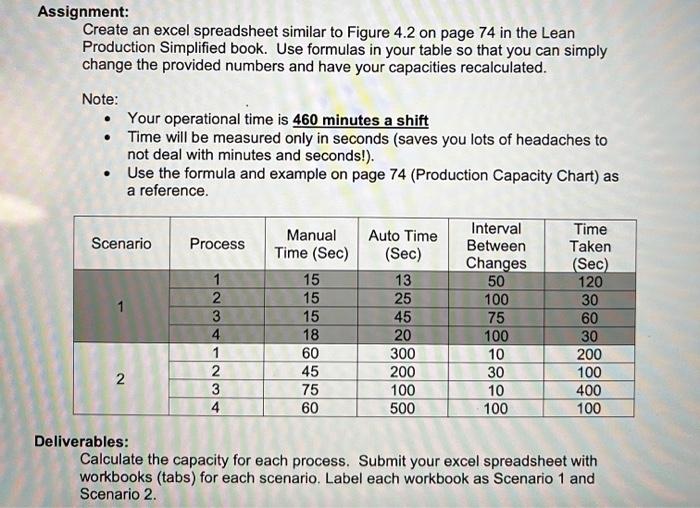
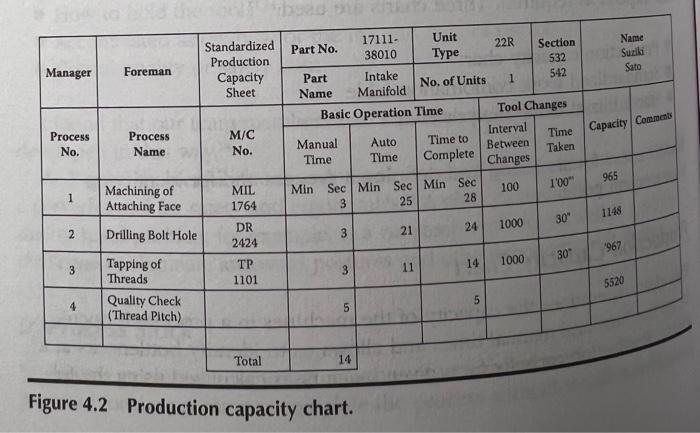
Assignment: Create an excel spreadsheet similar to Figure 4.2 on page 74 in the Lean Production Simplified book. Use formulas in your table so that you can simply change the provided numbers and have your capacities recalculated. Note: Your operational time is 460 minutes a shift Time will be measured only in seconds (saves you lots of headaches to not deal with minutes and seconds!). Use the formula and example on page 74 (Production Capacity Chart) as a reference. Scenario Process 1 2 3 4 1 2 3 4 Manual Time (Sec) 15 15 15 18 60 45 75 60 Auto Time (Sec) 13 25 45 20 300 200 100 500 Interval Between Changes 50 100 75 100 10 30 10 100 Time Taken (Sec) 120 30 60 30 200 100 400 100 2 AWN Deliverables: Calculate the capacity for each process. Submit your excel spreadsheet with workbooks (tabs) for each scenario. Label each workbook as Scenario 1 and Scenario 2. Name Suzili Sato Manager Standardized Production Capacity Sheet Foreman 17111- Unit Part No. 22R Section 38010 Type 532 Part Intake 542 1 No. of Units Name Manifold Basic Operation Time Tool Changes Interval Manual Auto Time to Time Between Time Time Complete Taken Changes Min Sec Min Sec Min Sec 100 3 25 28 Capacity Comments Process No. Process Name M/C No. 100" 965 1 MIL 1764 Machining of Attaching Face Drilling Bolt Hole 1148 30" 1000 24 2 21 DR 2424 3 967 30 1000 14 3 1101 3 11 Tapping of Threads Quality Check (Thread Pitch) 5520 5 4 5 Total 14 Figure 4.2 Production capacity chart. Assignment: Create an excel spreadsheet similar to Figure 4.2 on page 74 in the Lean Production Simplified book. Use formulas in your table so that you can simply change the provided numbers and have your capacities recalculated. Note: Your operational time is 460 minutes a shift Time will be measured only in seconds (saves you lots of headaches to not deal with minutes and seconds!). Use the formula and example on page 74 (Production Capacity Chart) as a reference. Scenario Process 1 2 3 4 1 2 3 4 Manual Time (Sec) 15 15 15 18 60 45 75 60 Auto Time (Sec) 13 25 45 20 300 200 100 500 Interval Between Changes 50 100 75 100 10 30 10 100 Time Taken (Sec) 120 30 60 30 200 100 400 100 2 AWN Deliverables: Calculate the capacity for each process. Submit your excel spreadsheet with workbooks (tabs) for each scenario. Label each workbook as Scenario 1 and Scenario 2. Name Suzili Sato Manager Standardized Production Capacity Sheet Foreman 17111- Unit Part No. 22R Section 38010 Type 532 Part Intake 542 1 No. of Units Name Manifold Basic Operation Time Tool Changes Interval Manual Auto Time to Time Between Time Time Complete Taken Changes Min Sec Min Sec Min Sec 100 3 25 28 Capacity Comments Process No. Process Name M/C No. 100" 965 1 MIL 1764 Machining of Attaching Face Drilling Bolt Hole 1148 30" 1000 24 2 21 DR 2424 3 967 30 1000 14 3 1101 3 11 Tapping of Threads Quality Check (Thread Pitch) 5520 5 4 5 Total 14 Figure 4.2 Production capacity chart
Step by Step Solution
There are 3 Steps involved in it

Get step-by-step solutions from verified subject matter experts