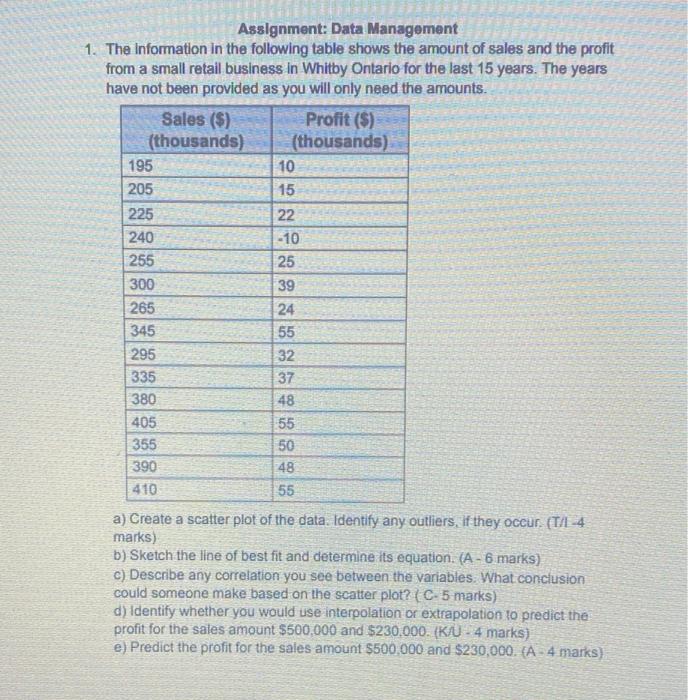
Question: Assignment: Data Management 1. The information in the following table shows the amount of sales and the profit from a small retail business In Whitby

Assignment: Data Management 1. The information in
Assignment: Data Management 1. The information in the following table shows the amount of sales and the profit from a small retail business In Whitby Ontario for the last 15 years. The years have not been provided as you will only need the amounts. Sales ($) Profit ($) (thousands) (thousands) 195 10 205 15 225 22 240 -10 255 25 300 39 265 24 345 55 295 32 335 37 380 48 405 55 355 50 390 48 410 55 a) Create a scatter plot of the data. Identify any outliers. If they occur. (T/I-4 marks) b) Sketch the line of best fit and determine its equation. (A - 6 marks) c) Describe any correlation you see between the variables. What conclusion could someone make based on the scatter plot? | C-5 marks) d) Identify whether you would use interpolation or extrapolation to predict the profit for the sales amount $500,000 and $230,000. (KAU - 4 marks) e) Predict the profit for the sales amount $500,000 and $230,000. A. 4 marks)

Step by Step Solution

There are 3 Steps involved in it

1 Expert Approved Answer
Step: 1 Unlock blur-text-image
Question Has Been Solved by an Expert!

Get step-by-step solutions from verified subject matter experts

Step: 2 Unlock
Step: 3 Unlock

Students Have Also Explored These Related General Management Questions!