

Question: Assignment Excel This picture below contains data for the number of pedestrians that were killed In the United States during 1994 In motor vehicle crashes.
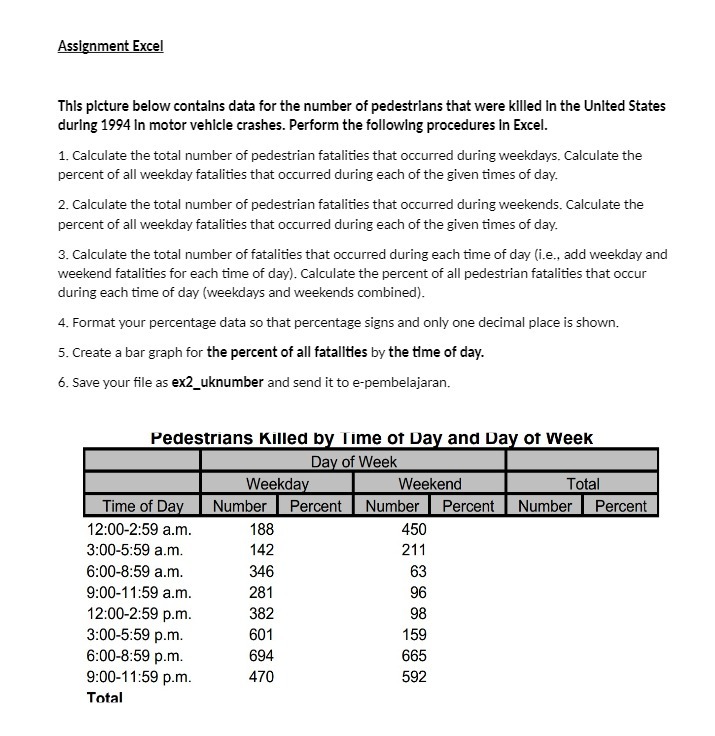
Assignment Excel This picture below contains data for the number of pedestrians that were killed In the United States during 1994 In motor vehicle crashes. Perform the following procedures In Excel. 1. Calculate the total number of pedestrian fatalities that occurred during weekdays. Calculate the percent of all weekday fatalities that occurred during each of the given times of day. 2. Calculate the total number of pedestrian fatalities that occurred during weekends. Calculate the percent of all weekday fatalities that occurred during each of the given times of day. 3. Calculate the total number of fatalities that occurred during each time of day (i.e., add weekday and weekend fatalities for each time of day). Calculate the percent of all pedestrian fatalities that occur during each time of day (weekdays and weekends combined). 4. Format your percentage data so that percentage signs and only one decimal place is shown. 5. Create a bar graph for the percent of all fatalities by the time of day. 6. Save your file as ex2_uknumber and send it to e-pembelajaran. Pedestrians Killed by Time of Day and Day of Week Day of Week Weekday Weekend Total Time of Day Number Percent Number Percent Number Percent 12:00-2:59 a.m. 188 450 3:00-5:59 a.m. 142 211 6:00-8:59 a.m. 346 63 9:00-11:59 a.m. 281 96 12:00-2:59 p.m. 382 98 3:00-5:59 p.m. 601 159 6:00-8:59 p.m. 694 665 9:00-11:59 p.m. 470 592 Total
Step by Step Solution
There are 3 Steps involved in it

Get step-by-step solutions from verified subject matter experts