

Question: Assignment file includes partial information from 50 customers of a bank on their Age, credit score, annual income, number of credit cards issued in their
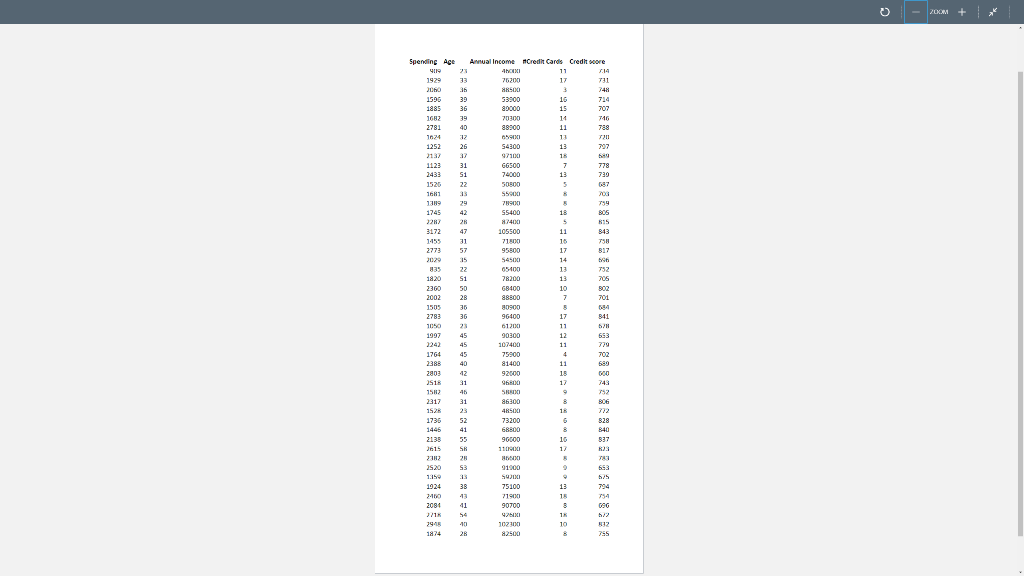
Assignment file includes partial information from 50 customers of a bank on their Age, credit score, annual income, number of credit cards issued in their name, and their last year spending on leisure travel as tracked by credit cards. This is part of the banks customer segmentation and the information will be shared with business partners to create advertising packages for each segment. At this step, we only focus on exploring the data and then finding factors that significantly influence customer spending. Do the following steps:
Create named ranges for all variables: Spending, Age, Annual_Income, Credit_Cards, and Credit_Score. Each range includes data only, not column header.
Use Excel Descriptive Statistics tool to create descriptive statistics for Spending in a new worksheet including the 3rd largest and 3rd smallest numbers in the range. Name this worksheet Descriptive.
In "Descriptive" worksheet, in front of each row of the output, enter worksheet function of the row statistic. AVERAGE for Mean, STDEV.S for Standard Error, , LARGE for 3rd largest, and SMALL for 3rd smallest numbers.
Create a histogram for Spending. Make a bin range with increments of 300. Decide about the minimum and maximum number in your bin so that the bin numbers are round, and the minimum number of bins are used. Save this histogram in a new worksheet named Histogram.
Use Excel rank and percentile tool to find the credit score rank of all customers. Save the output in a worksheet named Rank. Highlight the fifth highest credit score and its percentile.
Build a multiple regression model in a worksheet named Multiple Regression to find relationships between all predictors and Spending. Highlight only p-values of the coefficients that are significant at 5% significance level.
Create a correlation matrix in Data worksheet to find any potential multicollinearity. Highlight the highest correlation between the predictors (not between a predictor and response).
- us + Spending Age Annual Income Credit Cards Credit score ! 2-11 GG500 721 5540] 00SSOT 054 792) 39-1 UJE6 1120 U740] # ## % a 015 4 ase] 3377 a'id] - us + Spending Age Annual Income Credit Cards Credit score ! 2-11 GG500 721 5540] 00SSOT 054 792) 39-1 UJE6 1120 U740] # ## % a 015 4 ase] 3377 a'id]
Step by Step Solution
There are 3 Steps involved in it

Get step-by-step solutions from verified subject matter experts