

Question: Assignment : For Full marks you must show detailed calculations for your answers. Question 1: The owner of Maumee Motors wants to study the relationship
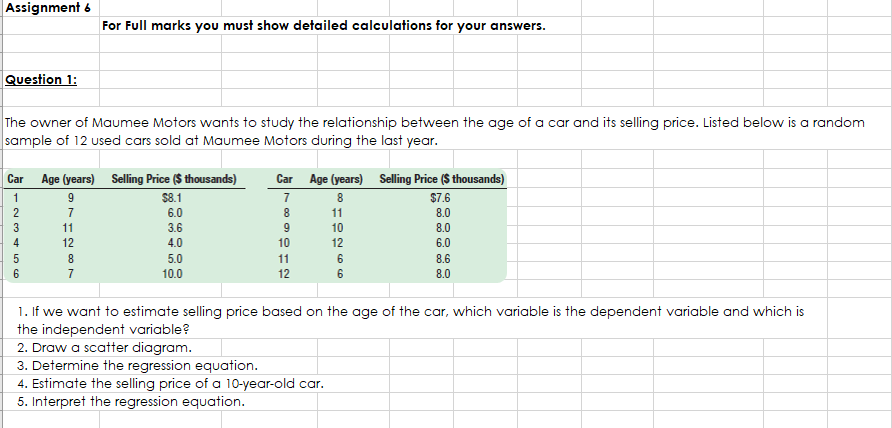
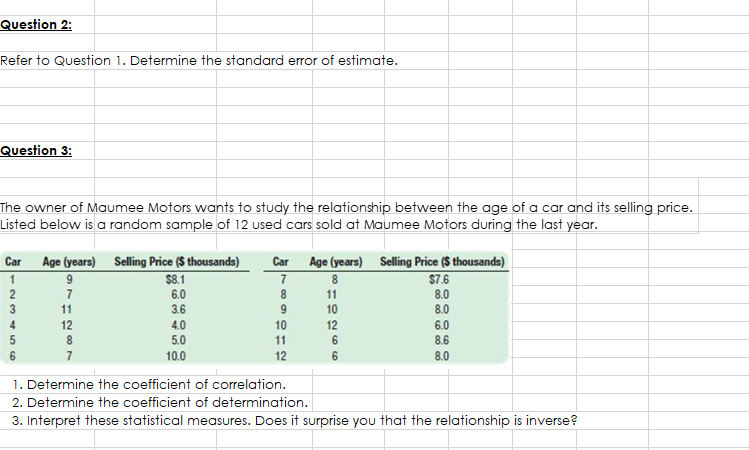


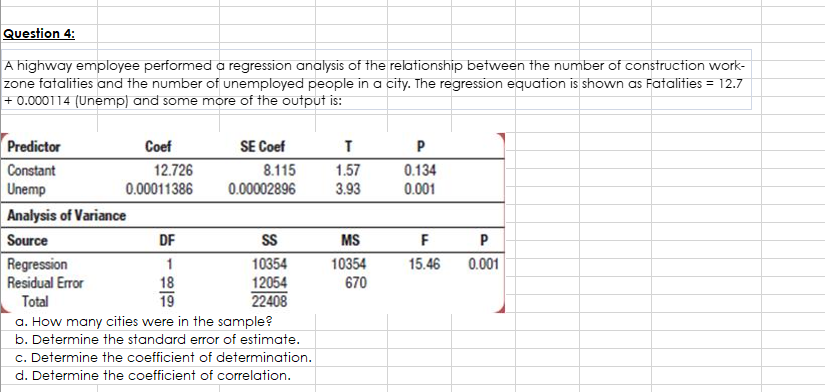
Assignment : For Full marks you must show detailed calculations for your answers. Question 1: The owner of Maumee Motors wants to study the relationship between the age of a car and its selling price. Listed below is a random sample of 12 used cars sold at Maumee Motors during the last year. Car Age (years) Selling Price ($ thousands) Car Age (years) Selling Price ($ thousands) $8.1 8 $7.6 6.0 11 8.0 11 3.6 9 10 8.0 12 4.0 10 12 6.0 5.0 11 6 3.6 10.0 12 8.0 1. If we want to estimate selling price based on the age of the car, which variable is the dependent variable and which is the independent variable? 2. Draw a scatter diagram. 3. Determine the regression equation. 4. Estimate the selling price of a 10-year-old car. 5. Interpret the regression equation.Question 2: Refer to Question 1. Determine the standard error of estimate. Question 3: The owner of Maumee Motors wants to study the relationship between the age of a car and its selling price. Listed below is a random sample of 12 used cars sold at Maumee Motors during the last year. Car Age (years) Selling Price ($ thousands) Car Age (years) Selling Price ($ thousands) $8.1 $7.6 6.0 8 11 8.0 11 3.6 10 8.0 12 4.0 10 12 6.0 5.0 11 6 8.6 10.0 12 B.0 1. Determine the coefficient of correlation. 2. Determine the coefficient of determination. 3. Interpret these statistical measures. Does it surprise you that the relationship is inverse?Question 4: A highway employee performed a regression analysis of the relationship between the number of construction work- zone fatalities and the number of unemployed people in a city. The regression equation is shown as Fatalities = 12.7 + 0.000114 (Unemp) and some more of the output is: Predictor Coef SE Coef P Constant 12.726 8.115 1.57 0.134 Unemp 0.00011386 0.00002896 3.93 0.001 Analysis of Variance Source DF SS MS F P Regression 1 10354 10354 15.46 0.001 Residual Error 18 12054 670 Total 19 22408 a. How many cities were in the sample? b. Determine the standard error of estimate. c. Determine the coefficient of determination. d. Determine the coefficient of correlation
Step by Step Solution
There are 3 Steps involved in it

Get step-by-step solutions from verified subject matter experts