

Question: ASSIGNMENT INFORMATION Create an Excel data file, this time with the following information: 10 fruits: 8 vegetables 5 starches 8 snacks 10 meats 1st column:
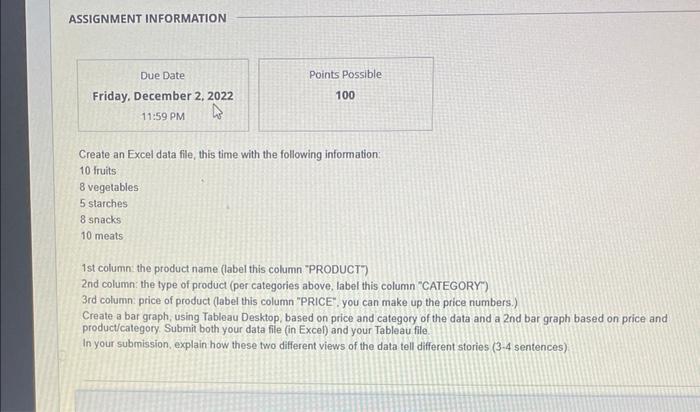
ASSIGNMENT INFORMATION Create an Excel data file, this time with the following information: 10 fruits: 8 vegetables 5 starches 8 snacks 10 meats 1st column: the product name (label this column "PRODUCT") 2nd column: the type of product (per categories above, label this column "CATEGORY") 3rd column: price of product (label this column "PRICE". you can make up the price numbers.) Create a bar graph, using Tableau Desktop, based on price and category of the data and a 2 nd bar graph based on price and product/category. Submit both your data fite (in Excel) and your Tableau file. In your submission, explain how these two different views of the data tell different stories (3.4 sentences)
Step by Step Solution
There are 3 Steps involved in it

Get step-by-step solutions from verified subject matter experts