

Question: Assignment MT 507.pdf Adobe Acrobat Pro File Edit View Document Comments Forms Tools Advanced Window Help Create Combine Collaborate Secure Sign Forms Multimedia Comment 5.
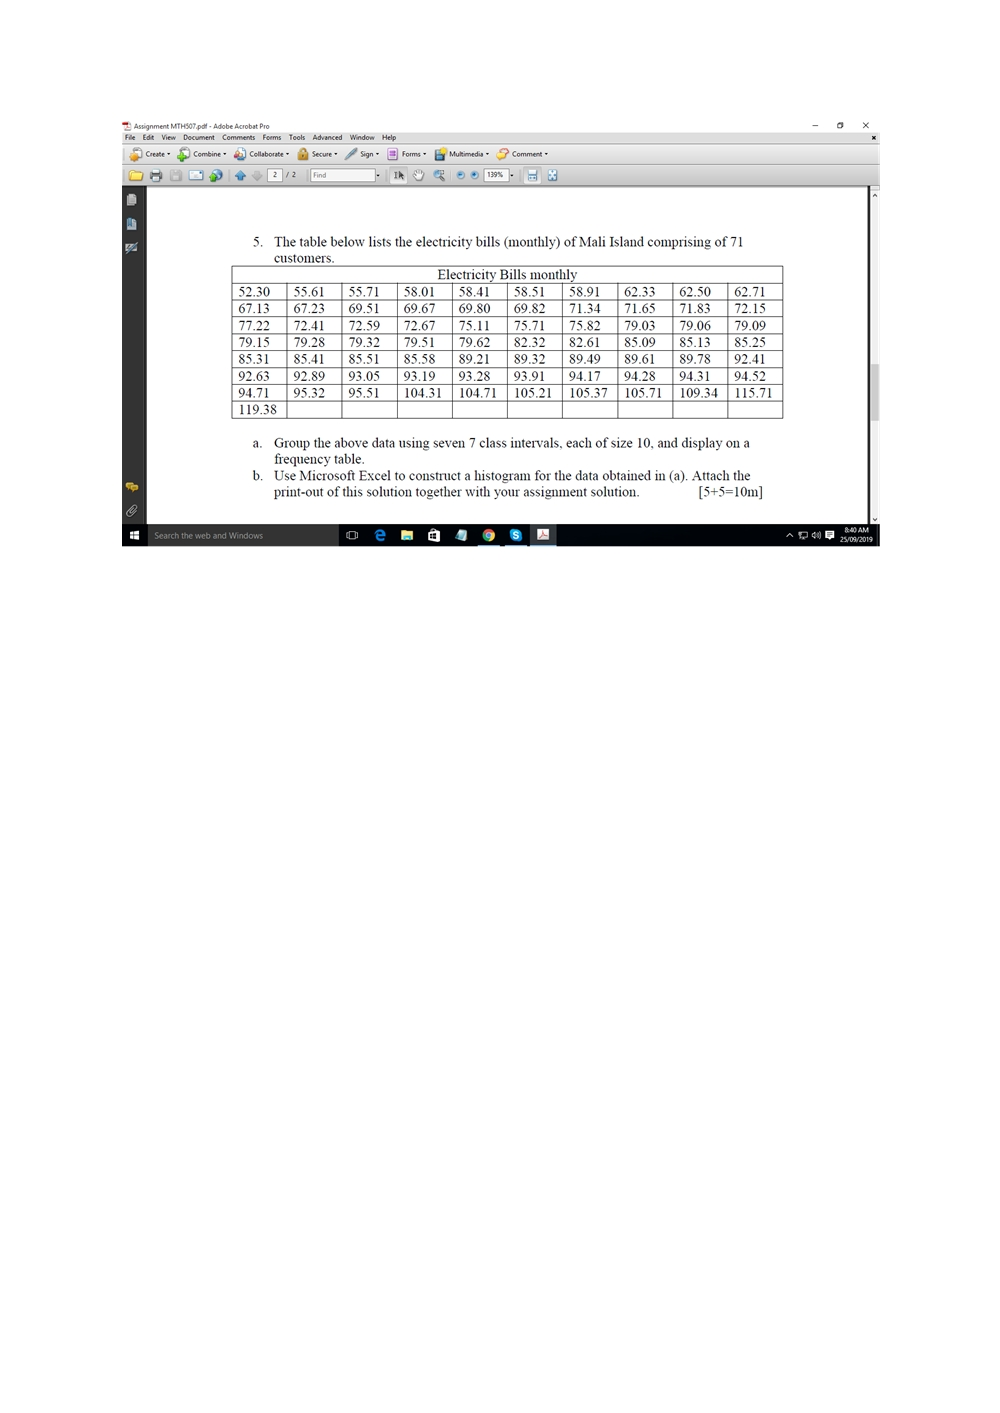
Assignment MT 507.pdf Adobe Acrobat Pro File Edit View Document Comments Forms Tools Advanced Window Help Create Combine Collaborate Secure Sign Forms Multimedia Comment 5. The table below lists the electricity bills (monthly) of Mali Island comprising of 71 customers. Electricity Bills monthly 52.30 55.61 55.71 58.01 58.41 58.51 58.91 62.33 62.50 62.71 67.13 67.23 69.51 69.67 7 69.8069.82 69.80 69.82 71.34 71.34 71.65 71.65 71 71.83 72.15 77.22 72.41 72.59 72.67 75.11 75.71 75.82 79.03 79.06 79.09 79.15 79.28 79.32 79.51 79.62 82.32 82.61 85.09 85.13 85.25 85.31 85.4185.51 85.58 89.2189.32 89.4989.61 89.78 92.41 92.63 92.8993.05 93.1993.28 93.91 94.17 94.28 94.31 94.52 94.71 95.32 95.51 104.31 104.71 105.21 105.37 105.71 109.34 115.71 119.38 Group the above data using seven 7 class intervals, each of size 10, and display on a frequency table. b. Use Microsoft Excel to construct a histogram for the data obtained in (a). Attach the print-out of this solution together with your assignment solution. [5+5=10m) &00 AM Search the web and Windows Oe O O S Assignment MT 507.pdf Adobe Acrobat Pro File Edit View Document Comments Forms Tools Advanced Window Help Create Combine Collaborate Secure Sign Forms Multimedia Comment 5. The table below lists the electricity bills (monthly) of Mali Island comprising of 71 customers. Electricity Bills monthly 52.30 55.61 55.71 58.01 58.41 58.51 58.91 62.33 62.50 62.71 67.13 67.23 69.51 69.67 7 69.8069.82 69.80 69.82 71.34 71.34 71.65 71.65 71 71.83 72.15 77.22 72.41 72.59 72.67 75.11 75.71 75.82 79.03 79.06 79.09 79.15 79.28 79.32 79.51 79.62 82.32 82.61 85.09 85.13 85.25 85.31 85.4185.51 85.58 89.2189.32 89.4989.61 89.78 92.41 92.63 92.8993.05 93.1993.28 93.91 94.17 94.28 94.31 94.52 94.71 95.32 95.51 104.31 104.71 105.21 105.37 105.71 109.34 115.71 119.38 Group the above data using seven 7 class intervals, each of size 10, and display on a frequency table. b. Use Microsoft Excel to construct a histogram for the data obtained in (a). Attach the print-out of this solution together with your assignment solution. [5+5=10m) &00 AM Search the web and Windows Oe O O S
Step by Step Solution
There are 3 Steps involved in it

Get step-by-step solutions from verified subject matter experts