

Question: Assignment No. 1 1. From following data below using the 2 2 # guideline.- 8. 1 . 4, 5 , 2, 3, 0, 9, 3,
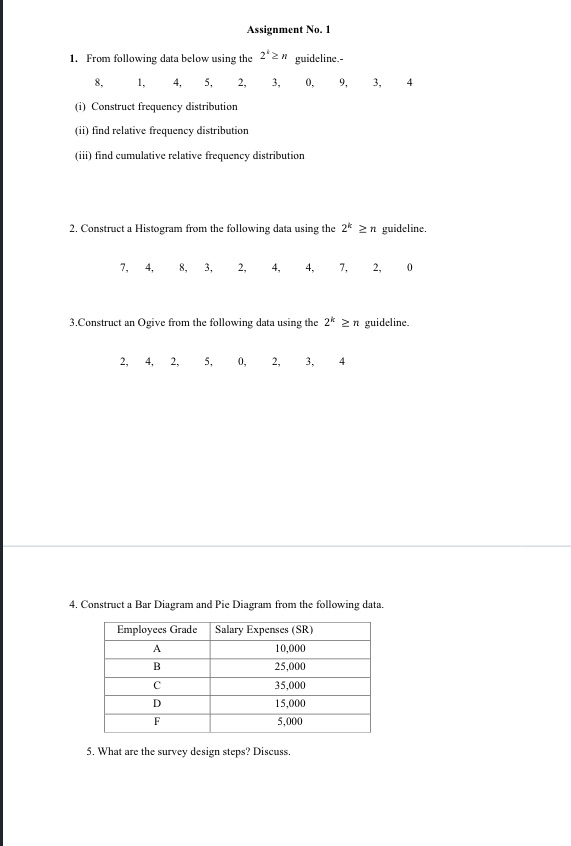
Assignment No. 1 1. From following data below using the 2 2 # guideline.- 8. 1 . 4, 5 , 2, 3, 0, 9, 3, 4 (i) Construct frequency distribution (ii) find relative frequency distribution (iii) find cumulative relative frequency distribution 2. Construct a Histogram from the following data using the 2" 2 n guideline. 7, 4, 8, 3, 2, 4, 4. 7, 2, 0 3.Construct an Ogive from the following data using the 2" 2 n guideline. 2, 4, 2, 5, 0, 2, 3, 4 4. Construct a Bar Diagram and Pie Diagram from the following data. Employees Grade Salary Expenses (SR) A 10,000 B 25,000 C 35,000 D 15,000 F 5,000 5. What are the survey design steps? Discuss
Step by Step Solution
There are 3 Steps involved in it
1 Expert Approved Answer
Step: 1 Unlock

Question Has Been Solved by an Expert!
Get step-by-step solutions from verified subject matter experts
Step: 2 Unlock
Step: 3 Unlock