

Question: Assignment Please note that this document will be updated with instructions for Excel during week 6. The purpose of this assignment is to explore the
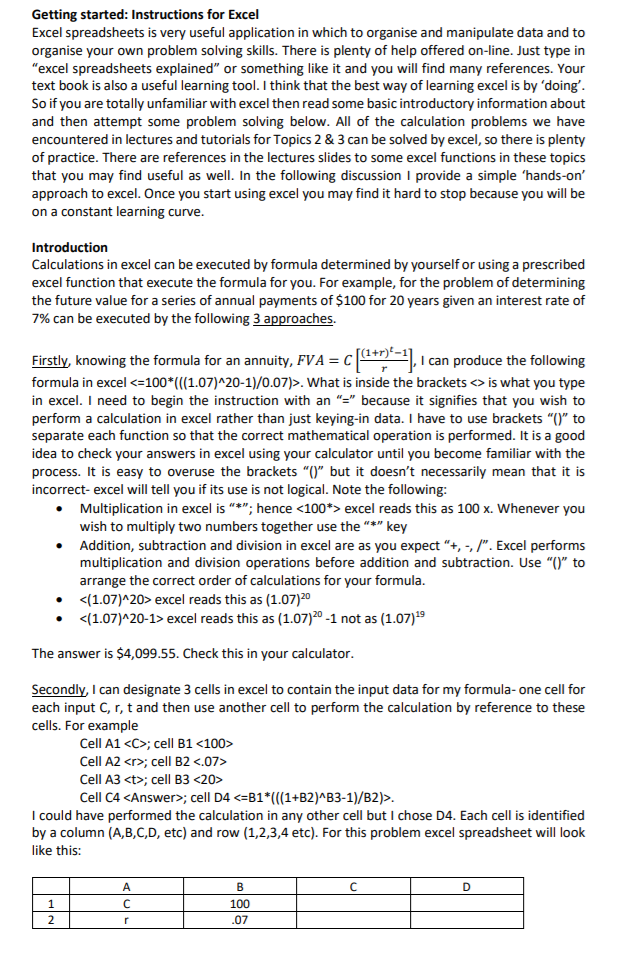
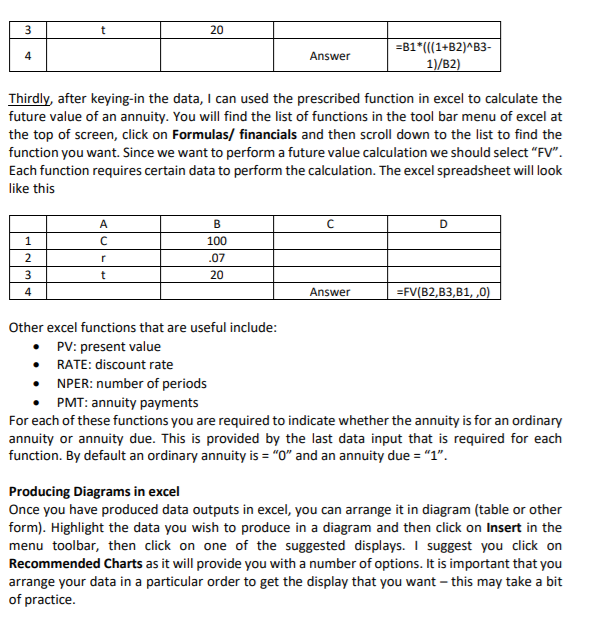
Assignment Please note that this document will be updated with instructions for Excel during week 6. The purpose of this assignment is to explore the capabilities of Excel spreadsheets and its applications for finance. This assignment must be done individually, is worth 20% of the total assessment for this subject and is not redeemable. Please read the following carefully The assignment due date is Friday, midnight, May 17th, (week 9). You are required to submit one excel file containing two excel spreadsheets, one for each question, electronically to myun There are 2 questions for this assignment. The first requires you to produce data for an amortised home loan whilst the second question requires you to determine the interest rate risk for bonds. A separate spreadsheet is required for each question. Question 1: You are required to produce an amortisation table for a home loan and a diagram demonstrating the link between loan repayments and principal outstanding. Please see slide 31 from Topic 2 (or p146 from text) for an example of the layout of the table. The home loan is for $200,000 and is to be amortised over a time period of 30 years requiring annual payments. All calculations should be executed in excel. From your table produce a diagram that demonstrates the relationship between the outstanding principal and the number of years into the loan. The interest rate to be used is 4% plus the last digit of your student number. For example if your student number ends in a '0, then the interest rate is 4%, but if your student number ends in a '9, then the interest rate is 13%. Assume that interest rates do not change over the life of the laon. Question 2: You are required to produce a table showing bond values and interest rate risk over the duration of a bond and a diagram demonstrating the link between interest rate risk and time to maturity. The bond has a face value of $1,000, pays a coupon rate of 9% and is issued with 10 years to maturity. All calculations should be executed in excel. Your table should show the following The value of the bond, year by year, from date of issue until its maturity, assuming all other things remain the same. The value of the bond, year by year, from date of issue until its maturity, assuming that market interest rate increases by 2%, all other things remain the same The potential capital gain/ loss, year by year, from the date of issue until its maturity The interest rate risk (%), year by year, for each year of maturity . . From your table produce a diagram that demonstrates the relationship between interest rate risk and time to maturity The market interest rate (yield to maturity) to be used is 4% plus the last digit of your student number. For example if your student number ends in a '0, then the yield to maturity is 496, but if your student number ends in a '9, then the yield to maturity is 13%. Assume that interest rates do not change Getting started: Instructions for Excel Excel spreadsheets is very useful application in which to organise and manipulate data and to organise your own problem solving skills. There is plenty of help offered on-line. Just type in "excel spreadsheets explained" or something like it and you will find many references. Your text book is also a useful learning tool. I think that the best way of learning excel is by 'doing So if you are totally unfamiliar with excel then read some basic introductory information about and then attempt some problem solving below. All of the calculation problems we have encountered in lectures and tutorials for Topics 2 & 3 can be solved by excel, so there is plenty of practice. There are references in the lectures slides to some excel functions in these topics that you may find useful as well. In the following discussion I provide a simple 'hands-on' approach to excel. Once you start using excel you may find it hard to stop because you will be on a constant learning curve Introduction Calculations in excel can be executed by formula determined by yourself or using a prescribed excel function that execute the formula for you. For example, for the problem of determining the future value for a series of annual payments of $100 for 20 years given an interest rate of 7% can be executed by the following 3 approaches. Eirstly, knowing the formula for an annuity. FVA CI can produce the following Firstly, knowing the formula for an annuity, FVA C formula in excel . What is inside the bracketsis what you type in excel. I need to begin the instruction with an "because it signifies that you wish to perform a calculation in excel rather than just keying-in data. I have to use brackets"" to separate each function so that the correct mathematical operation is performed. It is a good idea to check your answers in excel using your calculator until you become familiar with the process. It is easy to overuse the brackets "O" but it doesn't necessarily mean that it is incorrect- excel will tell you if its use is not logical. Note the following: Multiplication in excel is ""; hence excel reads this as 100 x. Whenever you wish to multiply two numbers together use the"key Addition, subtraction and division in excel are as you expect "+, -, /". Excel performs multiplication and division operations before addition and subtraction. Use "" to arrange the correct order of calculations for your formula. (1.07)20> excel reads this as (1.07)20 excel reads this as (1.07)20-1 not as (1.07)19 The answer is $4,099.55. Check this in your calculator Secondly, I can designate 3 cells in excel to contain the input data for my formula- one cell for each input C, r, t and then use another cell to perform the calculation by reference to these cells. For example Cell A1
Step by Step Solution
There are 3 Steps involved in it

Get step-by-step solutions from verified subject matter experts