

Question: Assignment Question: Table 1 is a transition matrix constructed using a panel data set from Brazil in which 764 households were interviewed in both 2010
Assignment Question: Table 1 is a transition matrix constructed using a panel data set from Brazil in which 764 households were interviewed in both 2010 and 2018. The rows of the matrix categorize households by their poverty status in 2010, while the columns show what percentage of households in a row had moved to the different living standard levels shown at the top of each column in 2018. The number in parentheses gives the number of households in each position in 2010.
1.) What percent of the entire sample of households were transitory and chronically poor? [Report your answer to 2 decimals; for example. 18.45%]
2) What percent of the entire sample of households were transitory and chronically poor? [Report your answer to 2 decimals; for example. 18.45%]
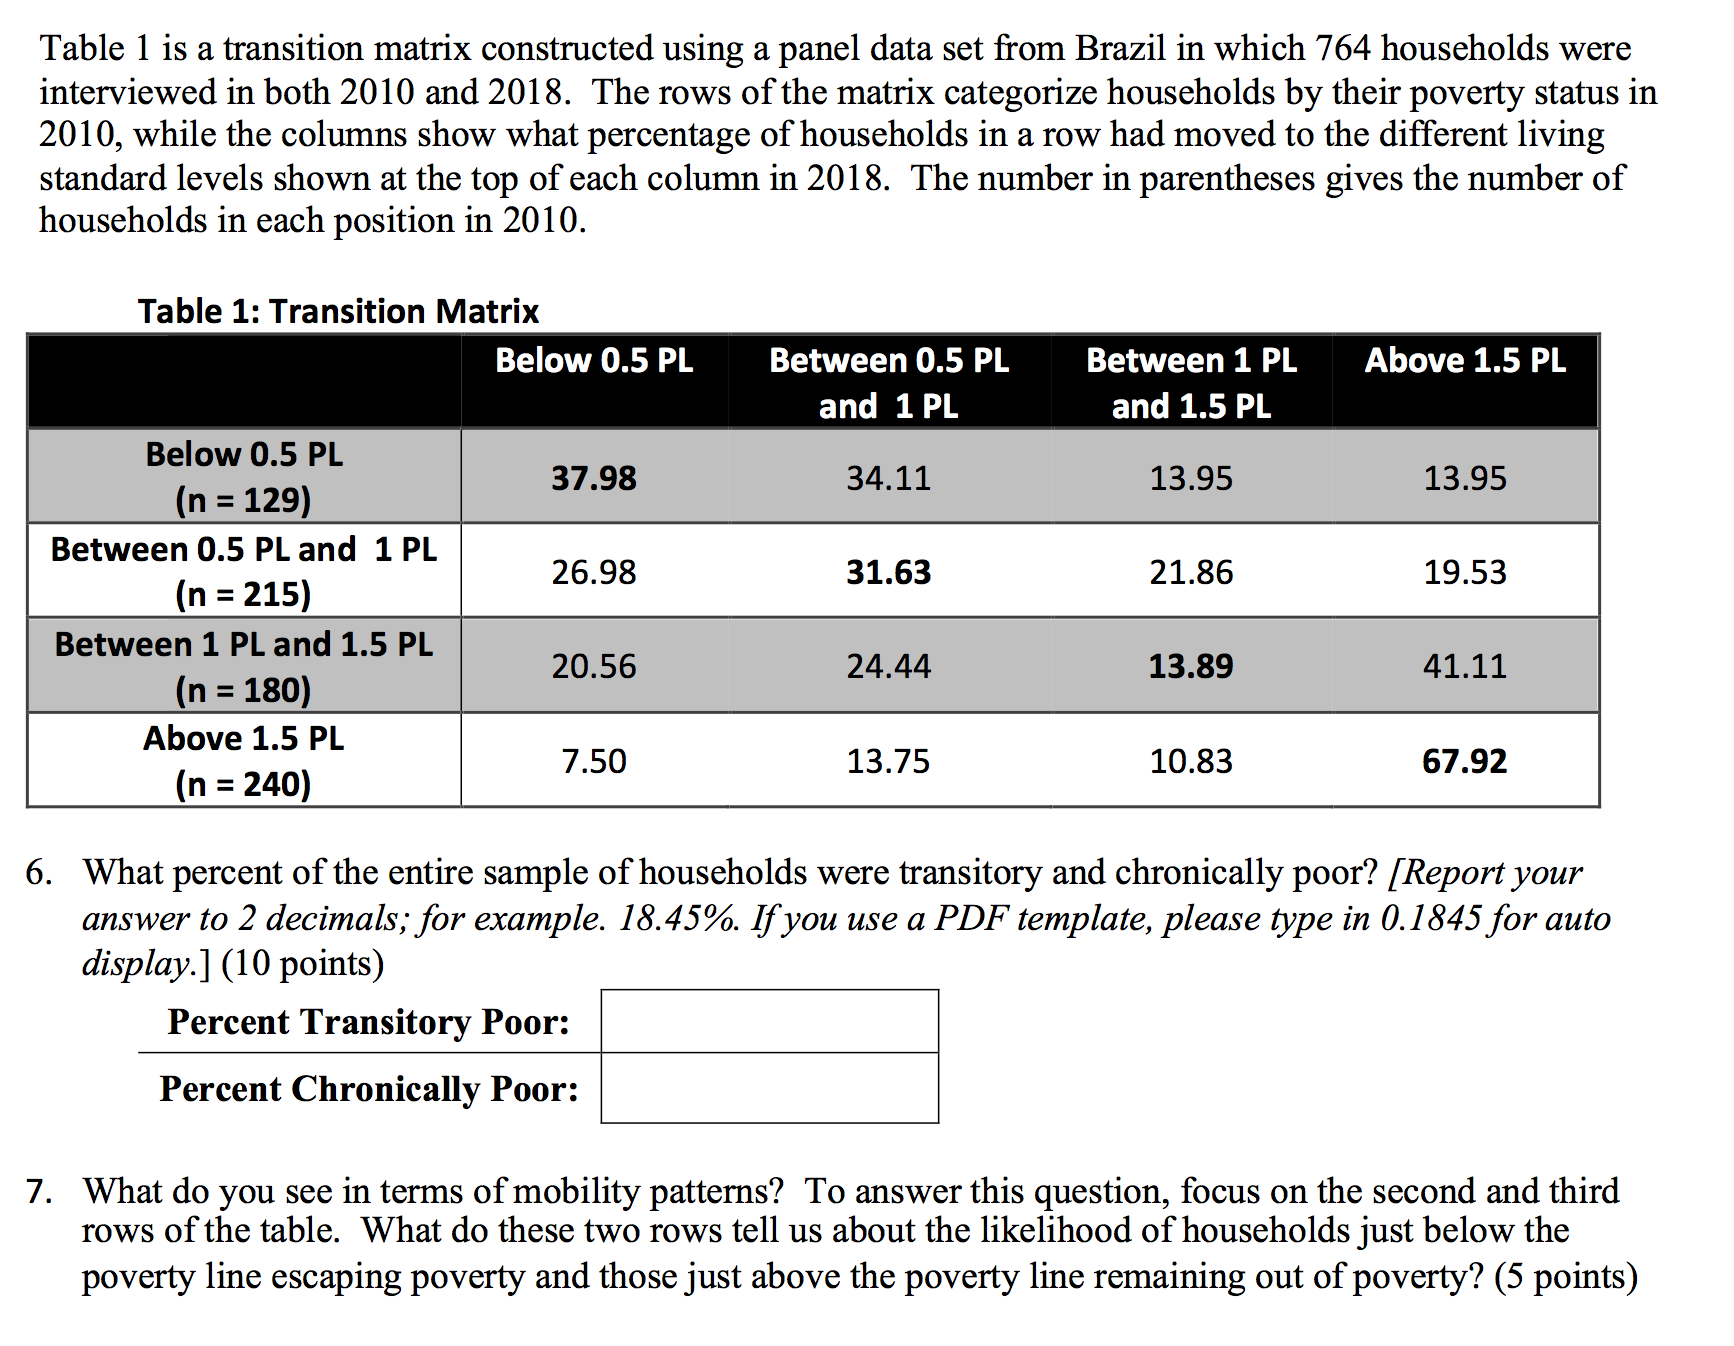
Table 1 is a transition matrix constructed using a panel data set from Brazil in which 764 households were interviewed in both 2010 and 2018. The rows of the matrix categorize households by their poverty status in 2010, while the columns show what percentage of households in a row had moved to the different living standard levels shown at the top of each column in 2018. The number in parentheses gives the number of households in each position in 2010. Table 1: Transition Matrix Below 0.5 PL Between 0.5 PL Between 1 PL Above 1.5 PL and 1 PL and 1.5 PL Between 0.5 PL and 1 PL in = 215) 26.98 Above 1.5 PL in = 240) 6. What percent of the entire sample of households were transitory and chronically poor? [Report your answer to 2 decimals; for example. 18.45%. If you use a PDF template, please type in 0.1 845 for auto display] (10 points) Percent Transitory Poor: Percent Chronically Poor: 7. What do you see in terms of mobility patterns? To answer this question, focus on the second and third rows of the table. What do these two rows tell us about the likelihood of households just below the poverty line escaping poverty and those just above the poverty line remaining out of poverty? (5 points)
Step by Step Solution
There are 3 Steps involved in it

Get step-by-step solutions from verified subject matter experts