Question: Assignment Requirements Download the relevant data into a spreadsheet and complete (show) the needed calculation accordingly. Provide written answers to both questions in the spreadsheet.
Assignment Requirements
Download the relevant data into a spreadsheet and complete (show) the needed calculation accordingly.
Provide written answers to both questions in the spreadsheet.
Submit your project report in a spreadsheet where you need to
Show raw data as downloaded and specify the date of downloading
Select (highlight data in your spreadsheet) relevant data and show needed calculations.
Provide written answers to questions.
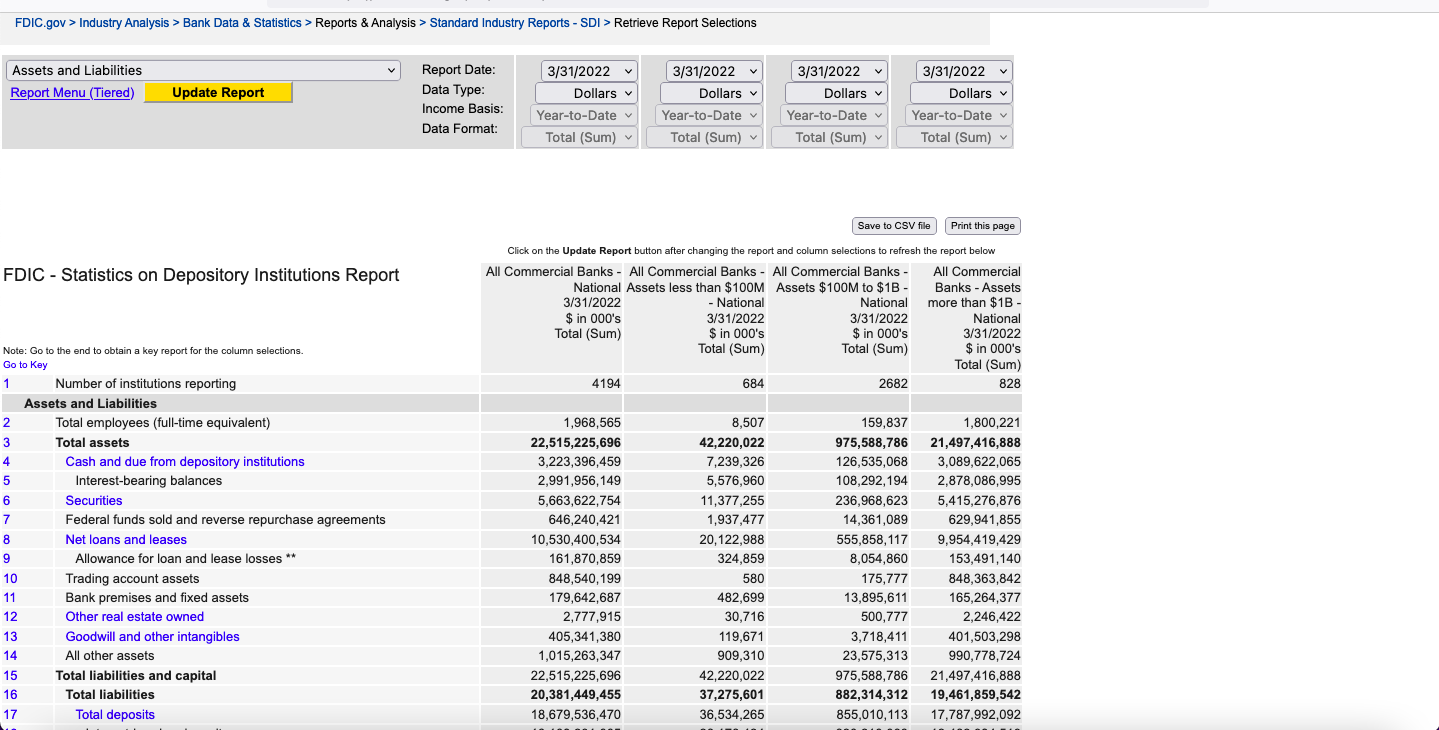
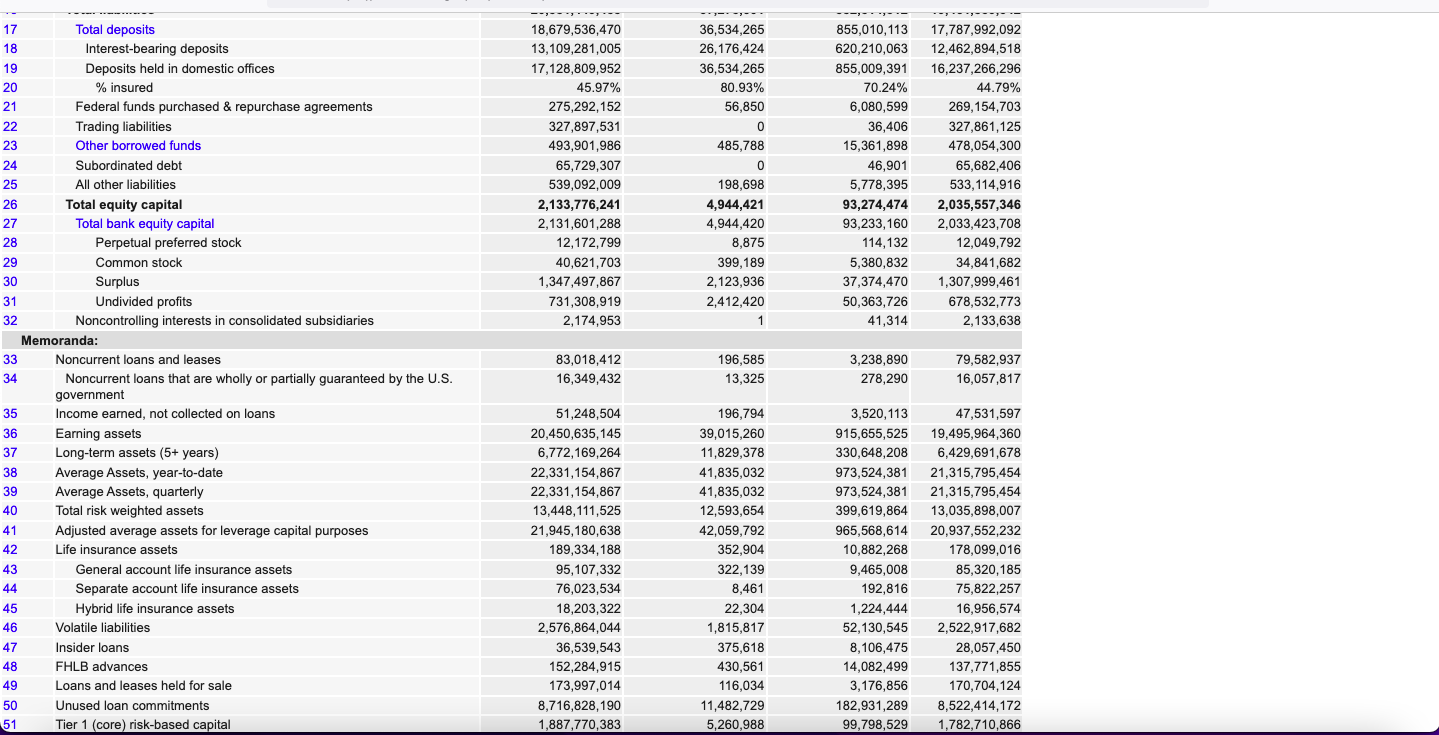
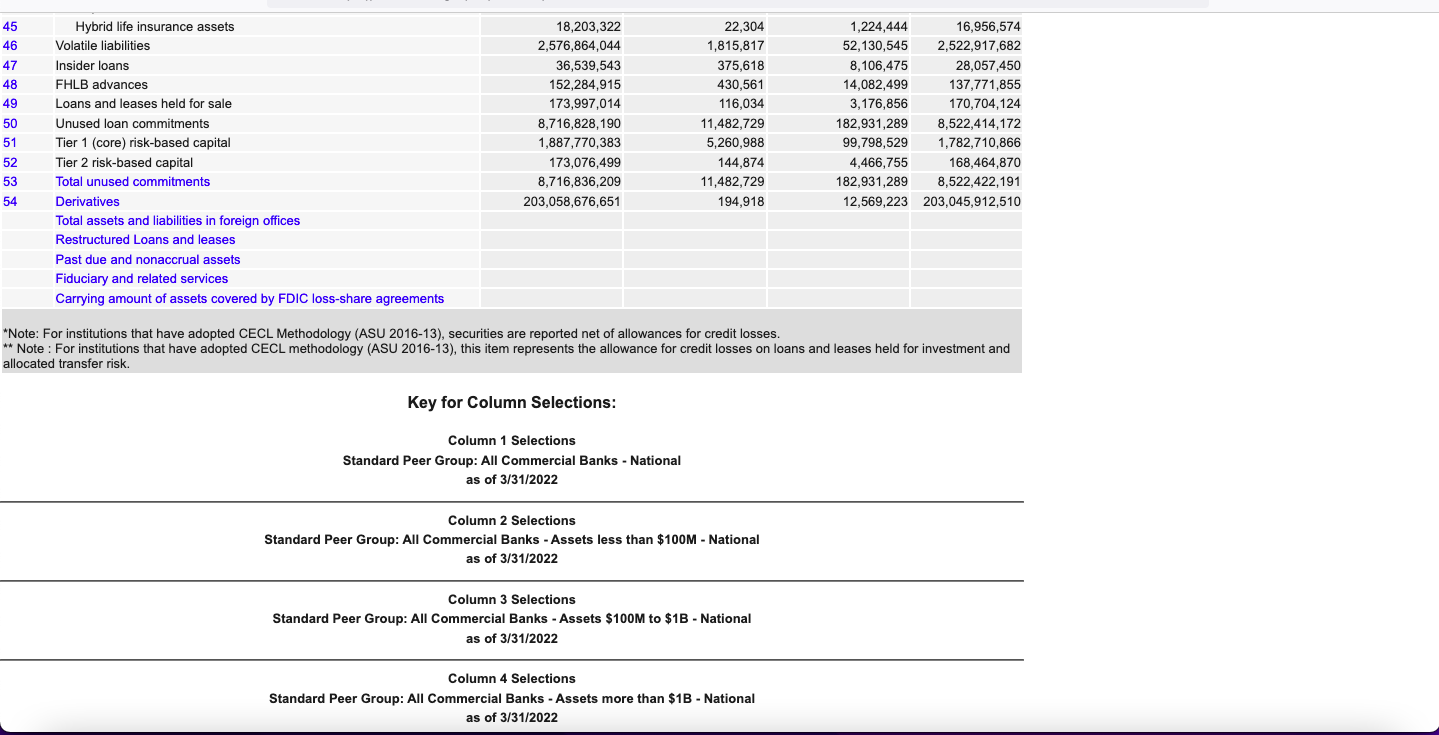
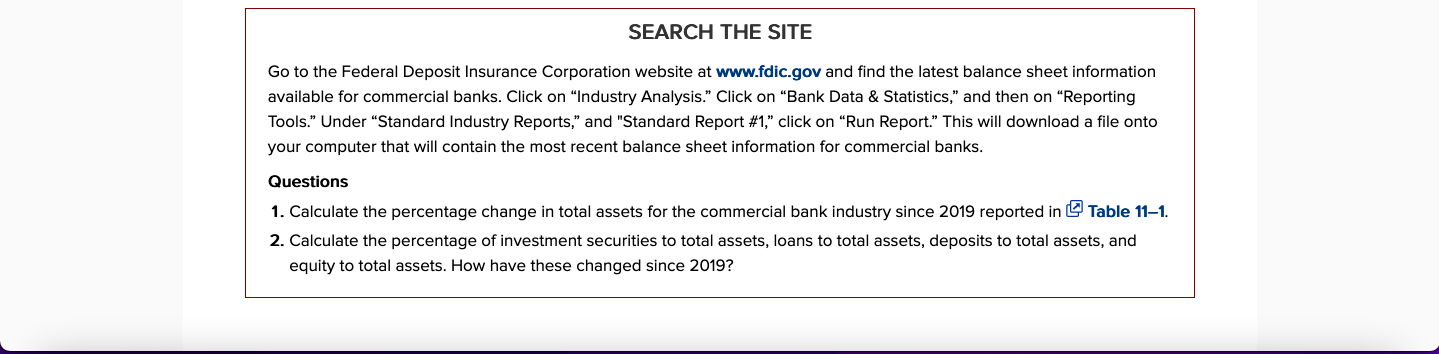
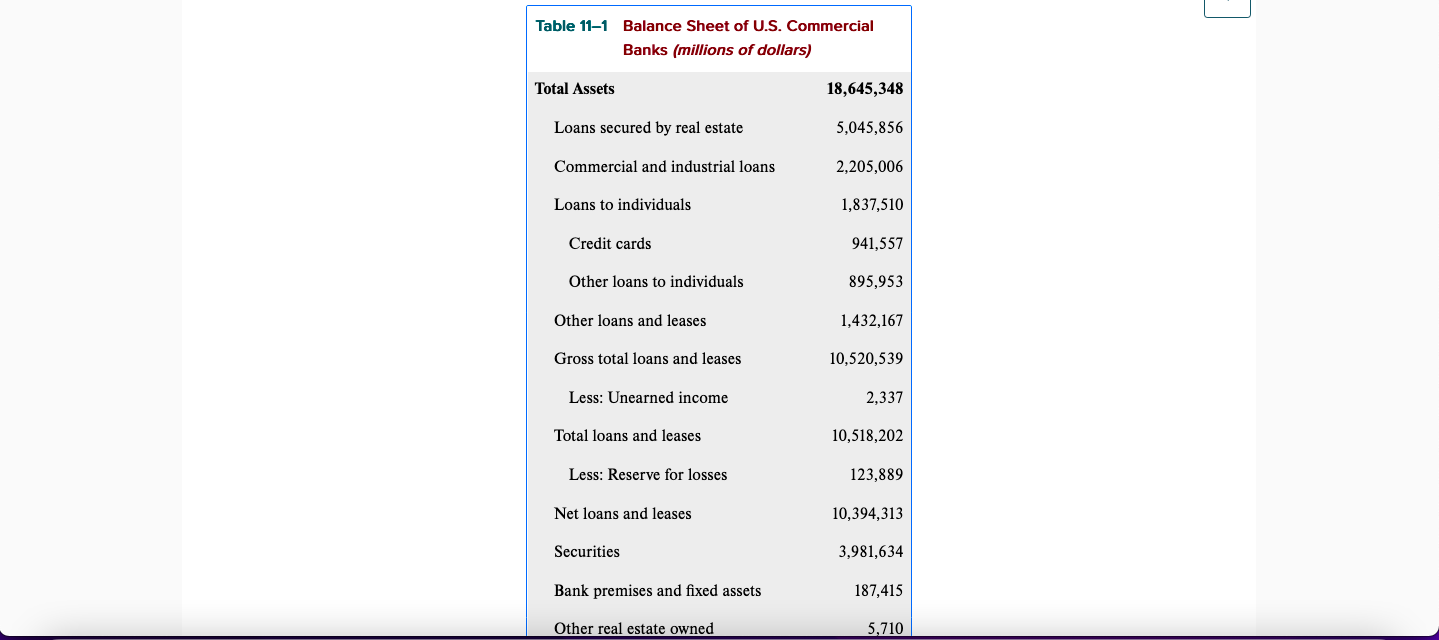
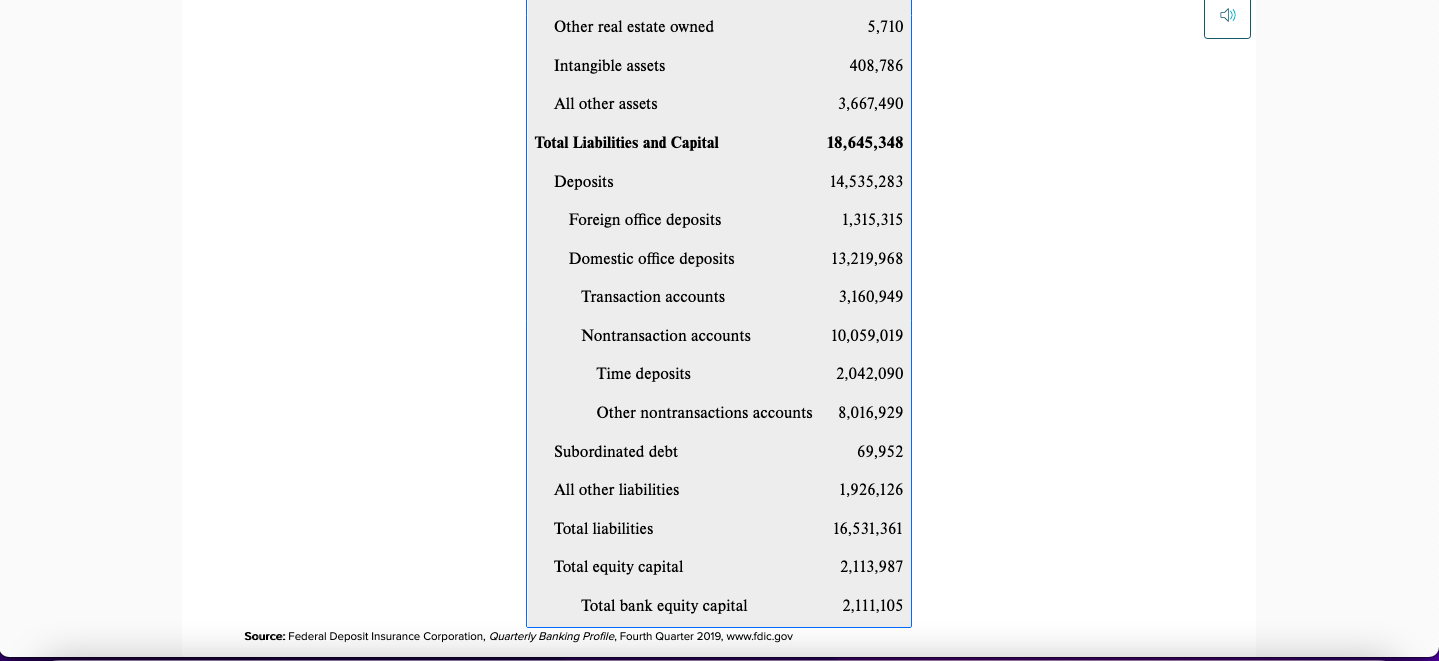
FDIC.gov > Industry Analysis > Bank Data & Statistics > Reports & Analysis > Standard Industry Reports - SDI > Retrieve Report Selections Assets and Liabilities Report Date: 3/31/2022 3/31/2022 3/31/2022 3/31/2022 Report Menu (Tiered) Update Report Data Type: Dollars Dollars Dollars Dollars Income Basis: Year-to-Date Year-to-Date v Year-to-Date v Year-to-Date v Data Format: Total (Sum) v Total (Sum) v Total (Sum) v Total (Sum) Save to CSV file Print this page Click on the Update Report button after changing the report and column selections to refresh the report below FDIC - Statistics on Depository Institutions Report All Commercial Banks - All Commercial Banks - All Commercial Banks - All Commercial National Assets less than $100M Assets $100M to $1B - Banks - Assets 3/31/2022 - National National more than $1B - $ in 000's 3/31/2022 3/31/2022 National Total (Sum) $ in 000's $ in 000's 3/31/2022 Note: Go to the end to obtain a key report for the column selections. Total (Sum) Total (Sum) $ in 000's Go to Key Total (Sum) 1 Number of institutions reporting 4194 684 2682 828 Assets and Liabilities Total employees (full-time equivalent) 1,968,565 8,507 159,837 1,800,221 Total assets 22,515,225,696 42,220,022 975,588,786 21,497,416,888 Cash and due from depository institutions 3,223,396,459 7,239,326 126,535,068 3,089,622,065 Interest-bearing balances 2,991,956, 149 5,576,960 108,292, 194 2,878,086,995 Securities 5,663,622,754 11,377,255 236,968,623 5,415,276,876 Federal funds sold and reverse repurchase agreements 646,240,421 1,937,477 14,361,089 629,941,855 Net loans and leases 10,530,400,534 20, 122,988 555,858, 117 9,954,419,429 Allowance for loan and lease losses ** 161,870,859 324,859 8,054,860 153,491,140 Trading account assets 848,540, 199 580 175,777 848,363,842 11 Bank premises and fixed assets 179,642,687 482,699 13,895,611 165,264,377 12 Other real estate owned 2,777,915 30,716 500,777 2,246,422 13 Goodwill and other intangibles 405,341,380 119,671 3,718,411 401,503,298 14 All other assets 1,015,263,347 909,310 23,575,313 990,778,724 15 Total liabilities and capital 22,515,225,696 42,220,022 975,588,786 21,497,416,888 16 Total liabilities 20,381,449,455 37,275,601 882,314,312 19,461,859,542 17 Total deposits 18,679,536,470 36,534,265 855,010, 113 17,787,992,09217 Total deposits 18,679,536,470 36,534,265 855,010, 113 17,787,992,092 18 Interest-bearing deposits 13, 109,281,005 26, 176,424 620,210,063 12,462,894,518 19 Deposits held in domestic offices 17,128,809,952 36,534,265 855,009,391 16,237,266,296 20 % insured 45.97% 80.93% 70.24% 44.79% 21 Federal funds purchased & repurchase agreements 275,292, 152 56,850 6,080,599 269, 154,703 22 Trading liabilities 327,897,531 36,406 327,861,125 23 Other borrowed funds 493,901,986 485,788 15,361,898 478,054,300 24 Subordinated debt 65,729,307 46,901 65,682,406 25 All other liabilities 539,092,009 198,698 5,778,395 533, 114,916 26 Total equity capital 2,133,776,241 4,944,421 93,274,474 2,035,557,346 27 Total bank equity capital 2,131,601,288 4,944,420 93,233, 160 2,033,423,708 28 Perpetual preferred stock 12,172,799 8,875 114, 132 12,049,792 29 Common stock 40,621,703 399, 189 5,380,832 34,841,682 30 Surplus 1,347,497,867 2, 123,936 37,374,470 1,307,999,461 31 Undivided profits 731,308,919 2,412,420 50,363,726 678,532,773 32 Noncontrolling interests in consolidated subsidiaries 2,174,953 41,314 2, 133,638 Memoranda: 33 Noncurrent loans and leases 83,018,412 196,585 3,238,890 79,582,937 34 Noncurrent loans that are wholly or partially guaranteed by the U.S. 16,349,432 13,325 278,290 16,057,817 government 35 Income earned, not collected on loans 51,248,504 196,794 3,520, 113 47,531,597 36 Earning assets 20,450,635, 145 39,015,260 915,655,525 19,495,964,360 37 Long-term assets (5+ years) 6,772, 169,264 11,829,378 330,648,208 6,429,691,678 38 Average Assets, year-to-date 22,331, 154,867 41,835,032 973,524,381 21,315,795,454 39 Average Assets, quarterly 22,331, 154,867 41,835,032 973,524,381 21,315,795,454 40 Total risk weighted assets 13,448, 111,525 12,593,654 399,619,864 13,035,898,007 41 Adjusted average assets for leverage capital purposes 21,945, 180,638 42,059,792 965,568,614 20,937,552,232 42 Life insurance assets 189,334, 188 352,904 10,882,268 178,099,016 43 General account life insurance assets 95, 107,332 322,139 9,465,008 85,320, 185 44 Separate account life insurance assets 76,023,534 8,461 192,816 75,822,257 45 Hybrid life insurance assets 18,203,322 22,304 1,224,444 16,956,574 46 Volatile liabilities 2,576,864,044 1,815,817 52, 130,545 2,522,917,682 47 Insider loans 36,539,543 375,618 8, 106,475 28,057,450 48 FHLB advances 152,284,915 430,561 14,082,499 137,771,855 49 Loans and leases held for sale 173,997,014 116,034 3,176,856 170,704,124 50 Unused loan commitments 8,716,828, 190 11,482,729 182,931,289 8,522,414,172 51 Tier 1 (core) risk-based capital 1,887,770,383 5,260,988 99,798,529 1,782,710,86645 Hybrid life insurance assets 18,203,322 22,304 1,224,444 16,956,574 46 Volatile liabilities 2,576,864,044 1,815,817 52, 130,545 2,522,917,682 47 Insider loans 36,539,543 375,618 8, 106,475 28,057,450 48 FHLB advances 152,284,915 430,561 14,082,499 137,771,855 49 Loans and leases held for sale 173,997,014 116,034 3, 176,856 170,704,124 50 Unused loan commitments 8,716,828, 190 11,482,729 182,931,289 8,522,414,172 51 Tier 1 (core) risk-based capital 1,887,770,383 5,260,988 99,798,529 1,782,710,866 52 Tier 2 risk-based capital 173,076,499 144,874 4,466,755 168,464,870 53 Total unused commitments 8,716,836,209 11,482,729 182,931,289 8,522,422, 191 54 Derivatives 203,058,676,651 194,918 12,569,223 203,045,912,510 Total assets and liabilities in foreign offices Restructured Loans and leases Past due and nonaccrual assets Fiduciary and related services Carrying amount of assets covered by FDIC loss-share agreements *Note: For institutions that have adopted CECL Methodology (ASU 2016-13), securities are reported net of allowances for credit losses. * Note : For institutions that have adopted CECL methodology (ASU 2016-13), this item represents the allowance for credit losses on loans and leases held for investment and allocated transfer risk. Key for Column Selections: Column 1 Selections Standard Peer Group: All Commercial Banks - National as of 3/31/2022 Column 2 Selections Standard Peer Group: All Commercial Banks - Assets less than $100M - National as of 3/31/2022 Column 3 Selections Standard Peer Group: All Commercial Banks - Assets $100M to $1B - National as of 3/31/2022 Column 4 Selections Standard Peer Group: All Commercial Banks - Assets more than $1B - National as of 3/31/2022SEARCH THE SITE Go to the Federal Deposit Insurance Corporation website at www.fdic.gov and nd the latest balance sheet Information available for commercial banks. Click on \"Industry Analysis.\" Click on \"Bank Data 8: Statistics," and then on \"Reporting Tools.\" Under \"Standard Industry Reports.\" and IStandard Report #1," click on \"Run Report." This will download a le onto your computer that will contain the most recent balance sheet Information for commercial banks. Questions 1. Calculate the percentage change In total assets for the commercial bank industry since 2019 reported in Table 111. 2. Calculate the percentage of Investment securities to total assets, loans to total assets. deposits to total assets, and equity to total assets. How have these changed since 2019? Table 11-1 Balance Sheet of U.S. Commercial Banks (millions of dollars) Total Assets 18,645,348 Loans secured by real estate 5,045,856 Commercial and industrial loans 2,205,006 Loans to individuals 1,837,510 Credit cards 941,557 Other loans to individuals 895,953 Other loans and leases 1,432,167 Gross total loans and leases 10,520,539 Less: Unearned income 2,337 Total loans and leases 10,518,202 Less: Reserve for losses 123,889 Net loans and leases 10,394,313 Securities 3,981,634 Bank premises and fixed assets 187,415 Other real estate owned 5,710Other real estate owned 5,710 Intangible assets 408,786 All other assets 3,667,490 Total Liabilities and Capital 18,645,348 Deposits 14,535,283 Foreign office deposits 1,315,315 Domestic office deposits 13,219,968 Transaction accounts 3,160,949 Nontransaction accounts 10,059,019 Time deposits 2,042,090 Other nontransactions accounts 8,016,929 Subordinated debt 69,952 All other liabilities 1,926,126 Total liabilities 16,531,361 Total equity capital 2,113,987 Total bank equity capital 2,111,105 Source: Federal Deposit Insurance Corporation, Quarterly Banking Profile, Fourth Quarter 2019, www.fdic.gov
Step by Step Solution
There are 3 Steps involved in it
1 Expert Approved Answer
Step: 1 Unlock
Question Has Been Solved by an Expert!
Get step-by-step solutions from verified subject matter experts
Step: 2 Unlock
Step: 3 Unlock
Students Have Also Explored These Related Accounting Questions!