

Question: < Assignment Spring 2022 Home Insert Draw Layout Review View Times New Roman 12 B I U aAv A EE Introduction: Risk is an
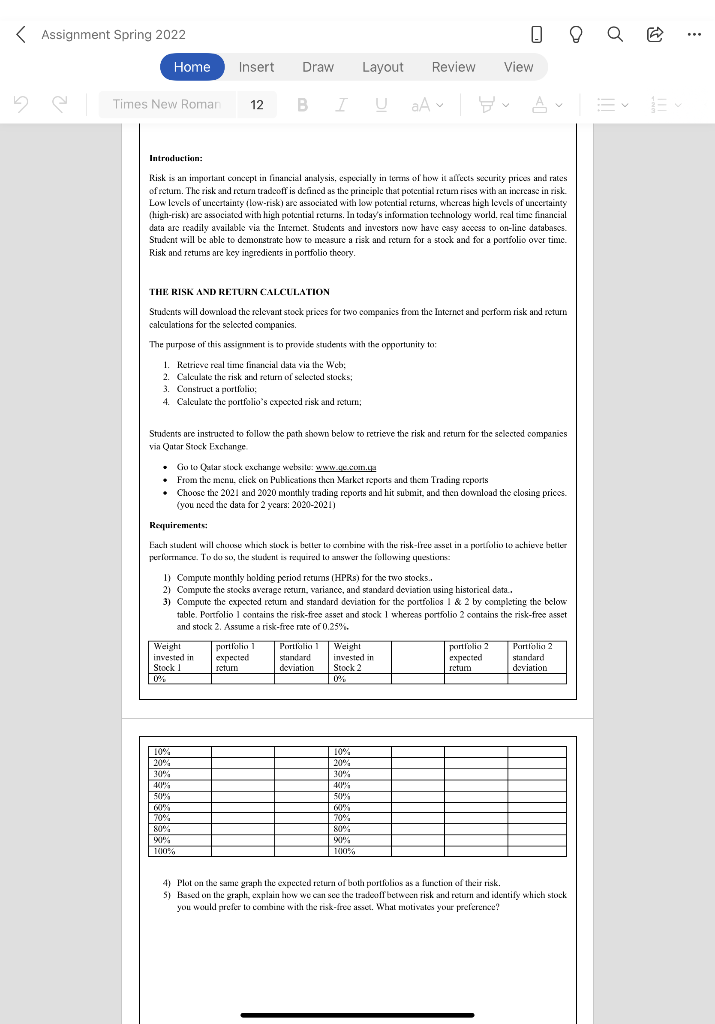
< Assignment Spring 2022 Home Insert Draw Layout Review View Times New Roman 12 B I U aAv A EE Introduction: Risk is an important concept in financial analysis, especially in terms of how it affects security prices and rates of retum. The risk and return tradeoff is defined as the principle that potential retum rises with an increase in risk. Low levels of uncertainty (low-risk) are associated with low potential returns, whereas high levels of uncertainty (high-risk) are associated with high potential returns. In today's information technology world, real time financial data are readily available via the Intemet. Students and investors now have easy access to on-line databases. Student will be able to demonstrate how to measure a risk and return for a stock and for a portfolio over time. Risk and retums are key ingredients in portfolio theory. THE RISK AND RETURN CALCULATION Students will download the relevant stock prices for two companies from the Internet and perform risk and return calculations for the selected companies. The purpose of this assignment is to provide students with the opportunity to: 1. Retrieve real time financial data via the Web; 2. Calculate the risk and return of selected stocks; 3. Construct a portfolio; 4. Calculate the portfolio's expected risk and return; Students are instructed to follow the path shown below to retrieve the risk and return for the selected companies via Qatar Stock Exchange. Go to Qular stock exchange website: www.ge.com.ca From the menu, click on Publications then Market reports and them Trading reports Choose the 2021 and 2020 monthly trading reports and hit submit, and then download the closing prices. (you need the data for 2 years: 2020-2021) Requirements: Each student will choose which stock is better to combine with the risk-free asset in a portfolio to achieve better performance. To do so, the student is required to answer the following questions: 1) Compute monthly holding period returns (HPRs) for the two stocks. 2) Compute the stocks average return, variance, and standard deviation using historical data.. 3) Compute the expected return and standard deviation for the portfolios 1 & 2 by completing the below table. Portfolio 1 contains the risk-free asset and stock 1 whereas portfolio 2 contains the risk-free asset and stock 2. Assume a risk-free rate of 0.25%. Weight invested in Stock portfolio 1 expected retum Portfolio 1 standard deviation Weight 0% invested in Stock 2 0% portfolio 2 expected retum Portfolio 2 standard deviation 10% 10% 20% 20% 30% 30% 40% 40% 50% 50% 60% 60% 70% 70% 80% 80% 90% 90% 100% 100% 4) Plot on the same graph the expected return of both portfolios as a function of their risk. 5) Based on the graph, explain how we can see the tradeoff between risk and return and identify which stock you would prefer to combine with the risk-free asset. What motivates your preference?
Step by Step Solution
There are 3 Steps involved in it

Get step-by-step solutions from verified subject matter experts