

Question: Assignment Submission For this assignment, you submit answers by question parts. The number of submissions remaining for each question part only changes if you submit
Assignment Submission
For this assignment, you submit answers by question parts. The number of submissions remaining for each question part only changes if you submit or change the answer.
Assignment Scoring
Your best submission for each question part is used for your score.
1.
[-/10 Points]
DETAILS
BBUNDERSTAT12 2.2.012.
MY NOTES
PRACTICE ANOTHER
Driving would be more pleasant if we didn't have to put up with the bad habits of other drivers. A newspaper reported the results of a Valvoline Oil Company survey of 500 drivers in which the drivers marked their complaints about other drivers. The top complaints turned out to be tailgating, marked by22%of the respondents; not using turn signals, marked by17%; being cut off, marked by14%; other drivers driving too slowly, marked by10%; and other drivers being inconsiderate marked by7%.
(a) Make a Pareto chart showing percentage of drivers listing each stated complaint.
(b) Could this information as reported be put in a circle graph? Why or why not?
Since the percentages add to 100%, a circle graph can be used.
Since the percentages do not add to 100%, a circle graph cannot be used and there is no way to adjust the categories.
Since the categories overlap, a circle graph cannot be used.
Since the percentages do not add to 100%, a circle graph cannot be used. If we create an "other" category and assume that all other respondents fit this category, then a circle could be created.
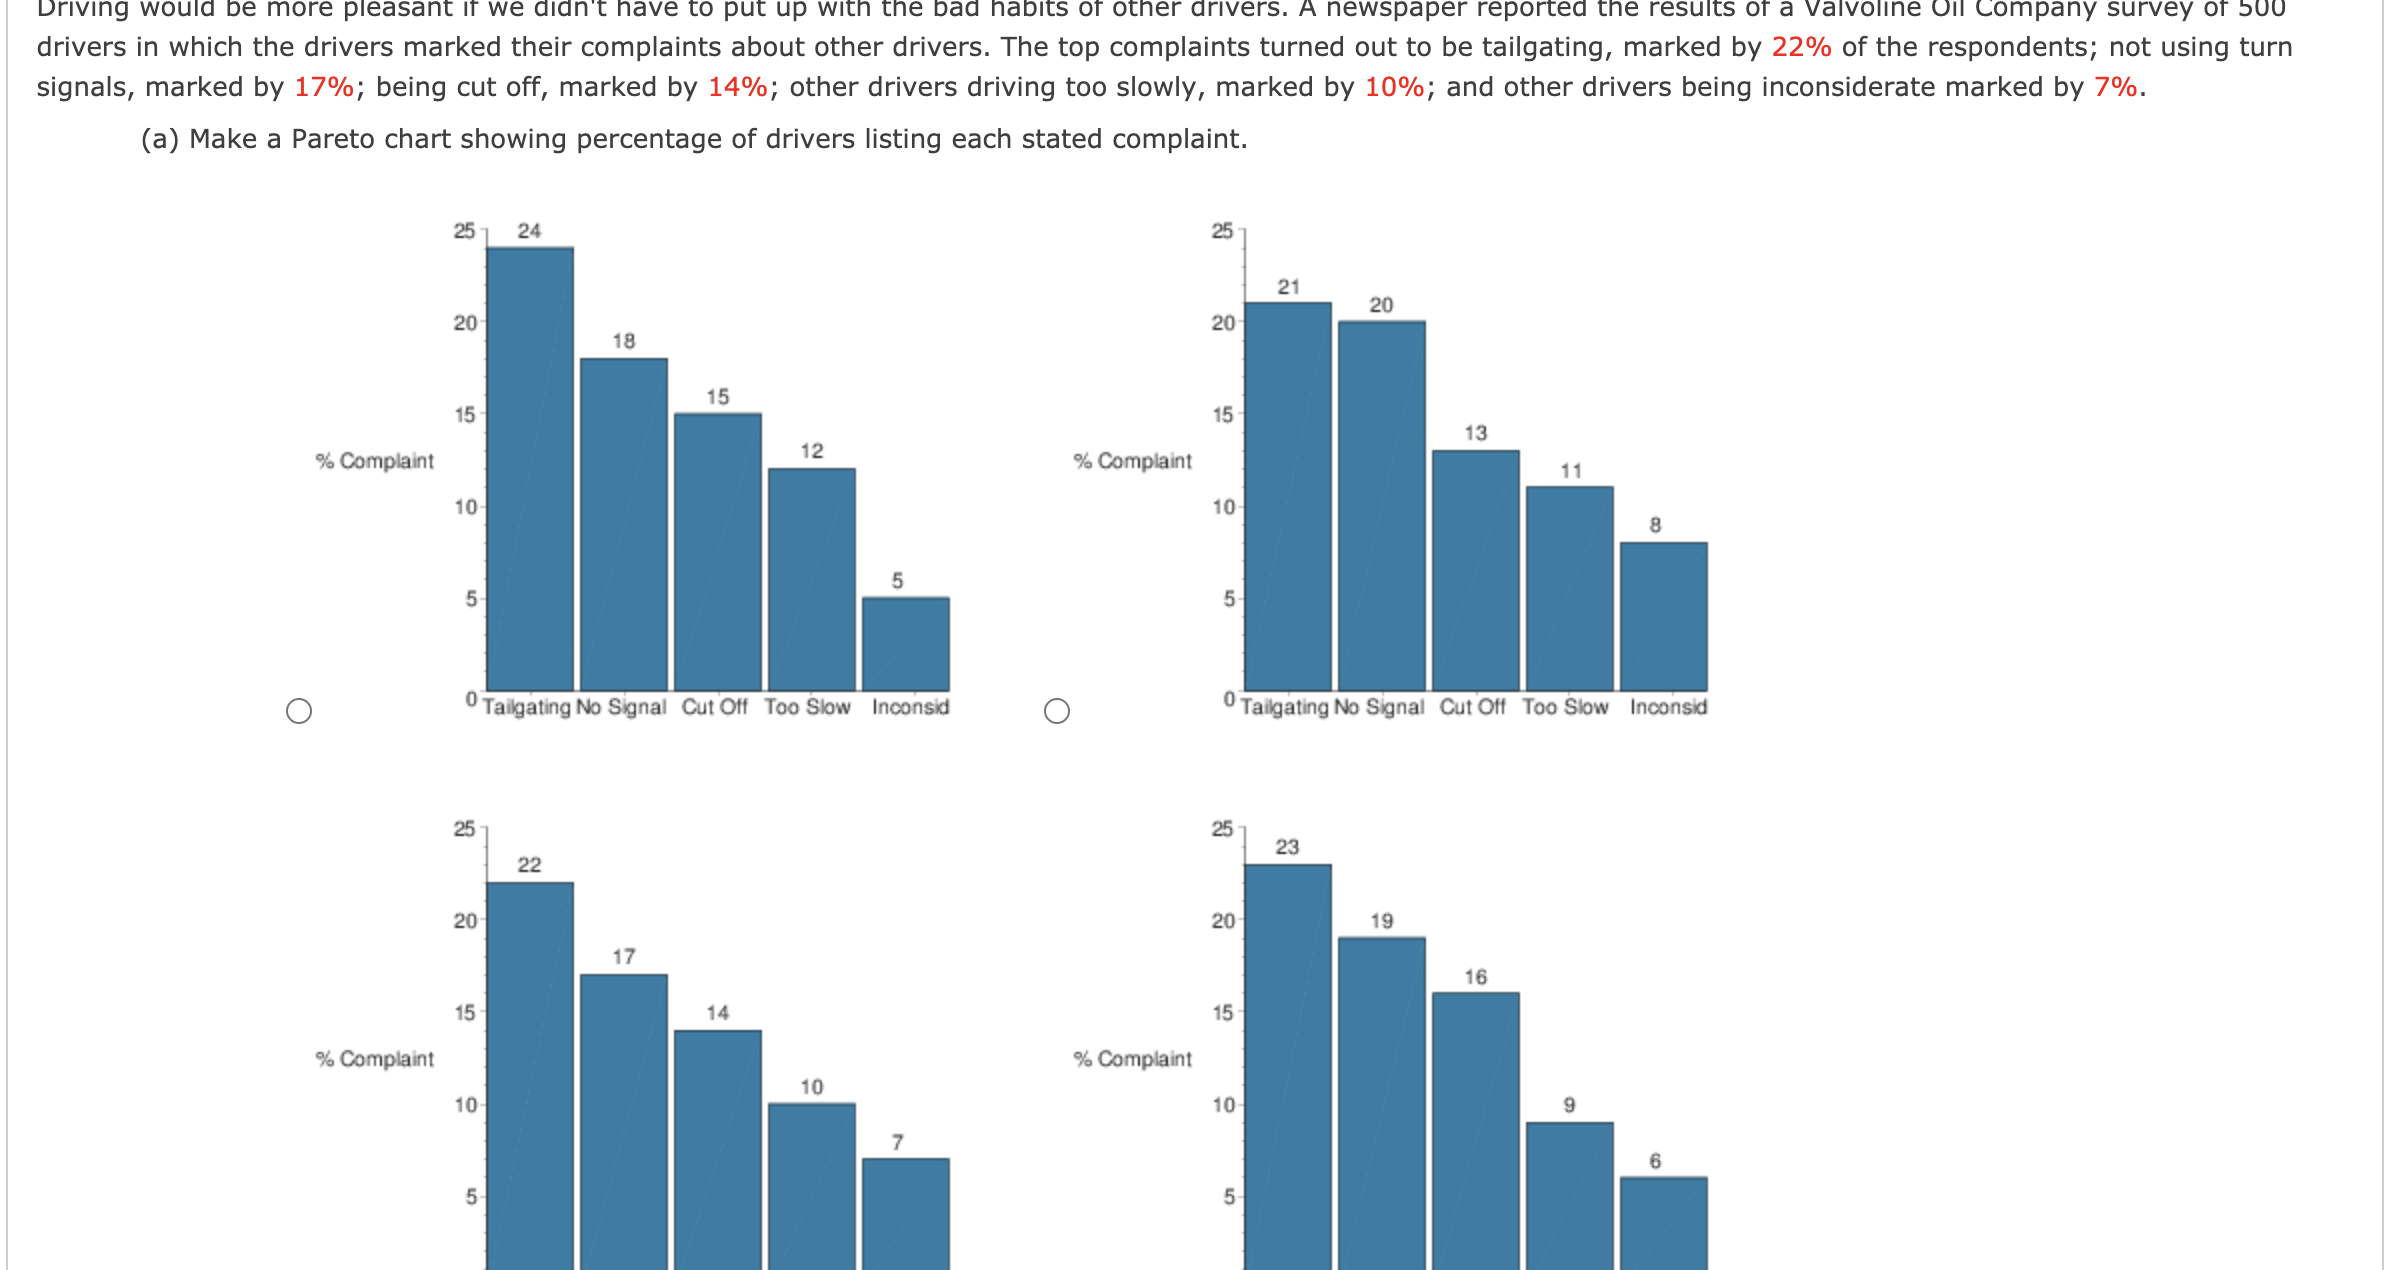
Driving would be more pleasant if we didn't have to put up with the bad habits of other drivers. A newspaper reported the results of a Valvoline Oil Company survey of 500 drivers in which the drivers marked their complaints about other drivers. The top complaints turned out to be tailgating, marked by 22% of the respondents; not using turn signals, marked by 17%; being cut off, marked by 14%; other drivers driving too slowly, marked by 10%; and other drivers being inconsiderate marked by 7%. (a) Make a Pareto chart showing percentage of drivers listing each stated complaint. 257 24 25 21 20 20 18 20 15 15 15 12 13 % Complaint Complaint 11 10 10 5 5 5 O 0 Tailgating No Signal Cut Off Too Slow Inconsid O Tailgating No Signal Cut Off Too Slow Inconsid 25 25 22 23 20 20 19 17 16 15 14 15 % Complaint % Complaint 10 10 10 7 5 5
Step by Step Solution
There are 3 Steps involved in it

Get step-by-step solutions from verified subject matter experts