

Question: Assignment: The following Table 1 reports numbers for the months of June and July, 2 0 1 8 . Using this table and the information
Assignment:
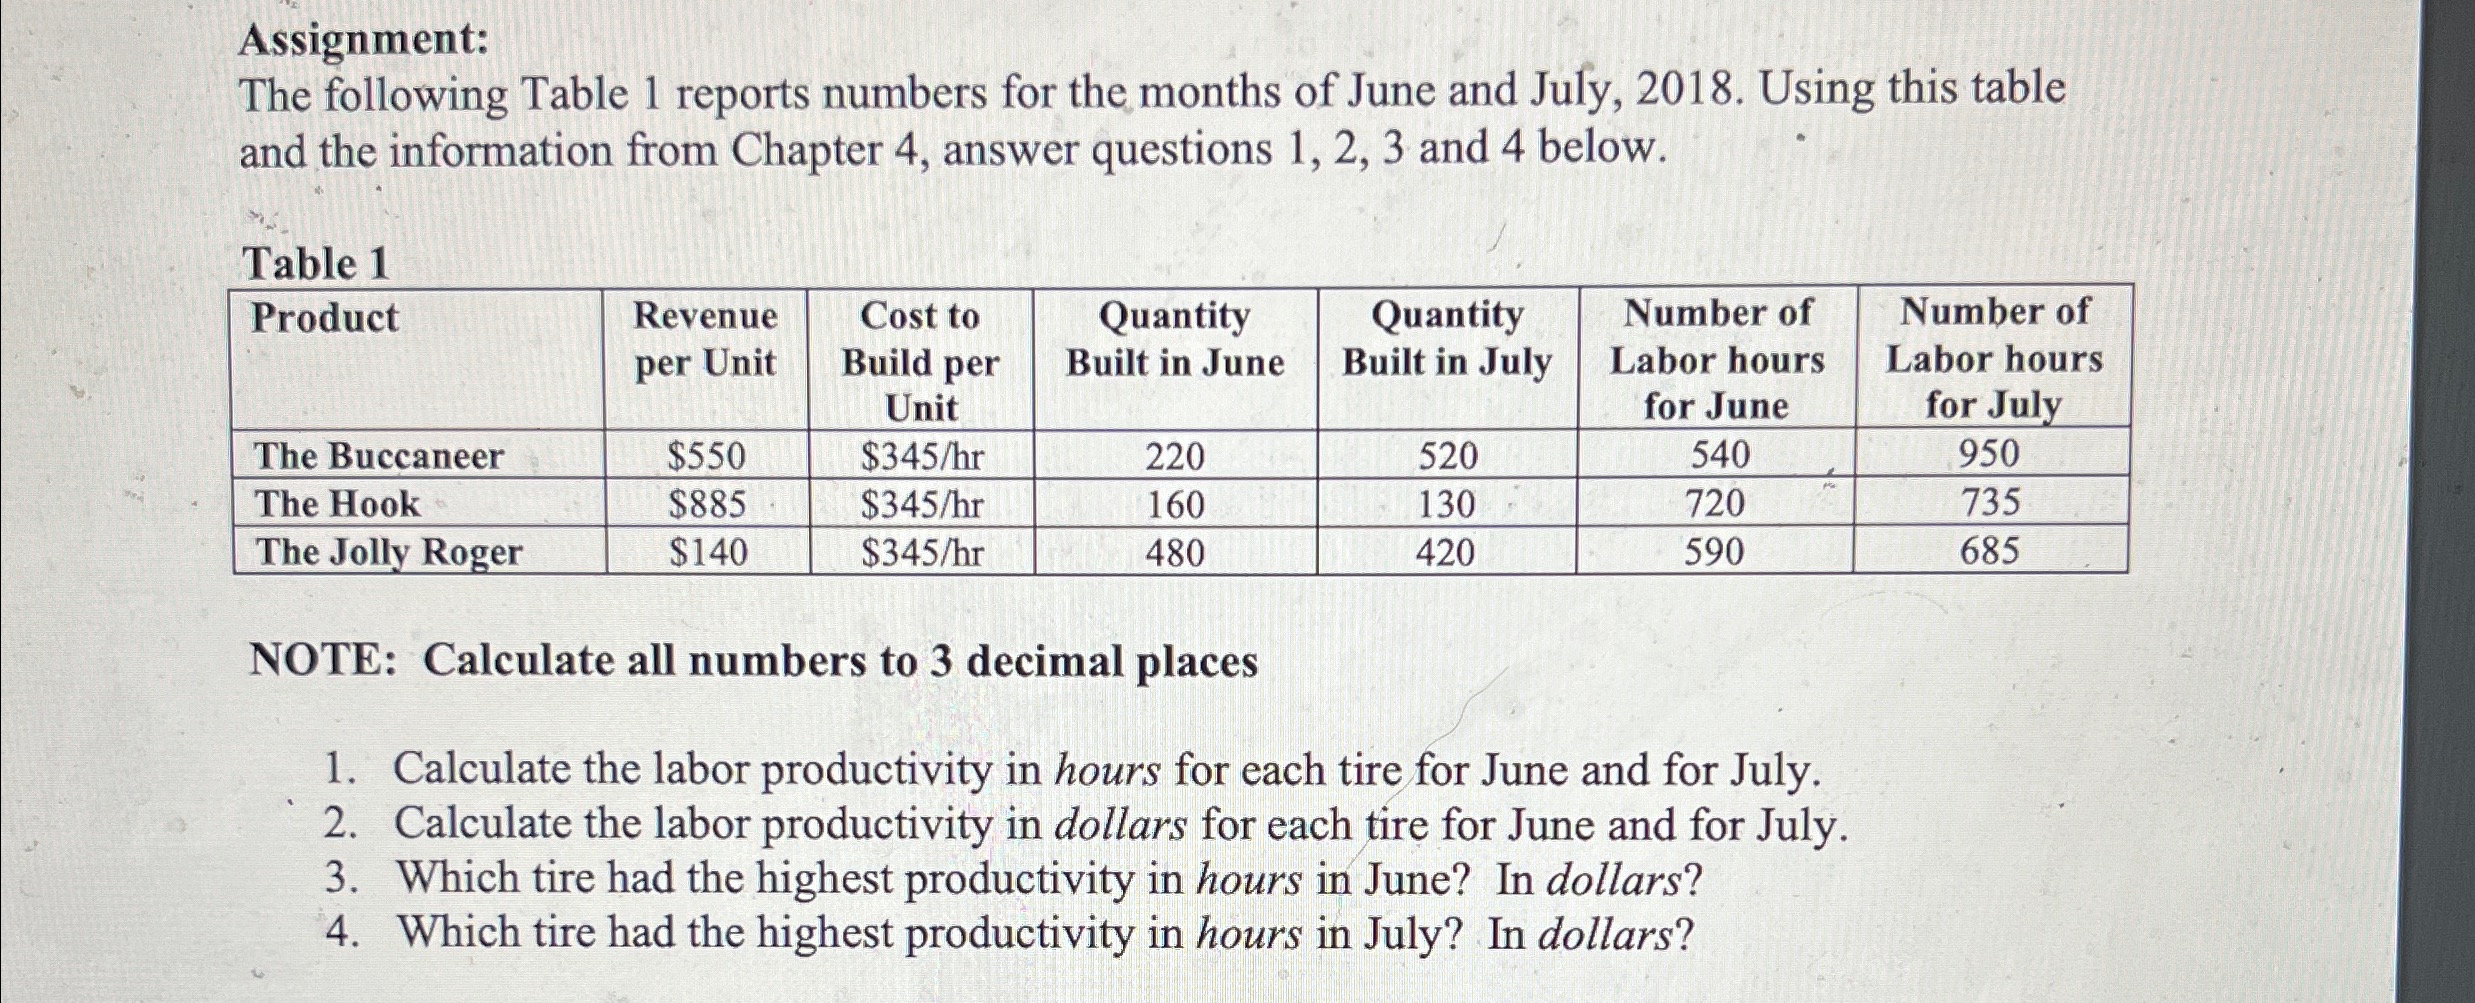
The following Table reports numbers for the months of June and July, Using this table and the information from Chapter answer questions and below.
Table
tableProducttableRevenueper UnittableCost toBuild perUnittableQuantityBuilt in JunetableQuantityBuilt in JulytableNumber ofLabor hoursfor JunetableNumber ofLabor hoursfor JulyThe Buccaneer,$$The Hook,$$The Jolly Roger,$$
NOTE: Calculate all numbers to decimal places
Calculate the labor productivity in hours for each tire for June and for July.
Calculate the labor productivity in dollars for each tire for June and for July.
Which tire had the highest productivity in hours in June? In dollars?
Which tire had the highest productivity in hours in July? In dollars?
Step by Step Solution
There are 3 Steps involved in it
1 Expert Approved Answer
Step: 1 Unlock

Question Has Been Solved by an Expert!
Get step-by-step solutions from verified subject matter experts
Step: 2 Unlock
Step: 3 Unlock