

Question: Assignment: Use the data below for three groups of high school freshmen students. The research question concerns whether two problem-solving interventions are effective at reducing
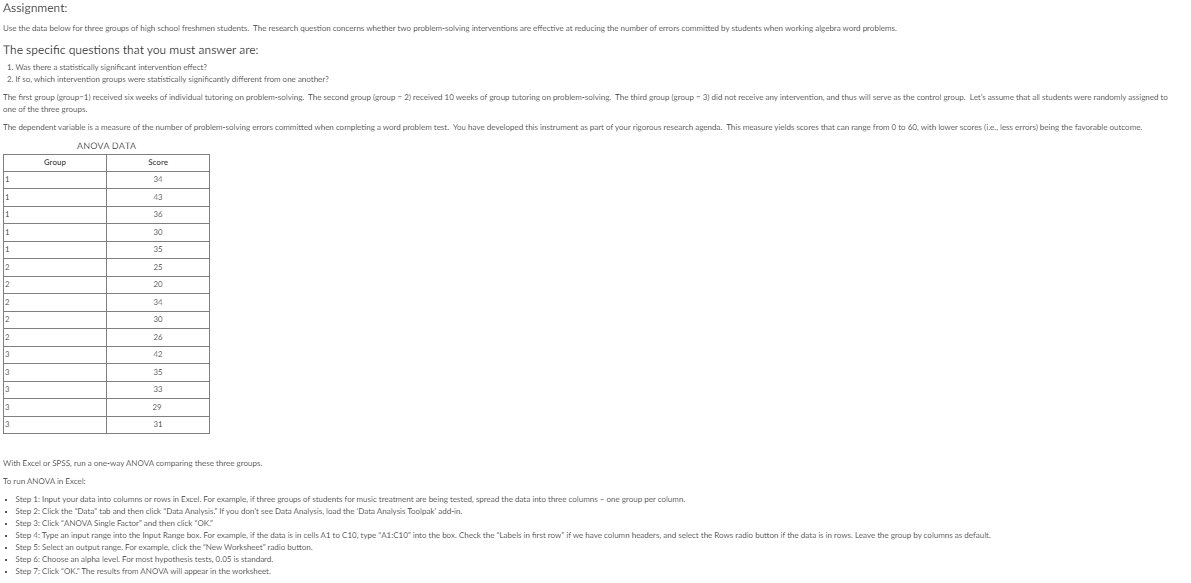
Assignment: Use the data below for three groups of high school freshmen students. The research question concerns whether two problem-solving interventions are effective at reducing the number of errors committed by students when working algebra word problems. The specific questions that you must answer are: 1. Was there a statistically significant intervention effect? 2. If so, which intervention groups were statistically significantly different from one another? The first group (group-1) received six weeks of individual tutoring on problem-solving. The second group (group - 2) received 10 weeks of group tutoring on problem-solving. The third group (group - 3) did not receive any intervention, and thus will serve as the control group. Let's assume that all students were randomly assigned to one of the three groups. The dependent variable is a measure of the number of problem-solving errors committed when completing a ward problem test. You have developed this instrument as part of your rigorous research agenda. This measure yields scores that can range from 0 to 80. with lower scores (i.e., less errors) being the favorable outcome. ANOVA DATA Group Score 34 1 43 36 1 30 35 25 20 34 26 42 35 33 29 31 With Excel or SPSS, run a one-way ANOVA comparing these three groups. To run ANOVA in Excel: Step 1: Input your data into columns or rows in Excel. For example, if three groups of students for music treatment are being tested, spread the data into three columns - one group per column. Step 2: Click the "Data" tab and then click "Data Analysis." If you don't see Data Analysis, load the 'Data Analysis Toolpak' add-in. Step 3: Click "ANOVA Single Factor" and then click "OK" Step 4: Type an input range into the Input Range box. For example, if the data is in cells Al to C10, type "A1:C10" into the box. Check the "Labels in first row" if we have column headers, and select the Rows radio button if the data is in rows. Leave the group by columns as default. Step 5: Select an output range. For example, click the "New Worksheet" radio button. Step & Choose an alpha level For most hypothesis tests, 0.05 is standard. Step 7: Click "OK." The results from ANOVA will appear in the worksheet
Step by Step Solution
There are 3 Steps involved in it

Get step-by-step solutions from verified subject matter experts