

Question: Assignment: Visualization Design In this assignment, you will design a visualization for a smal data set and provide a rigorous rationale for your design choices.
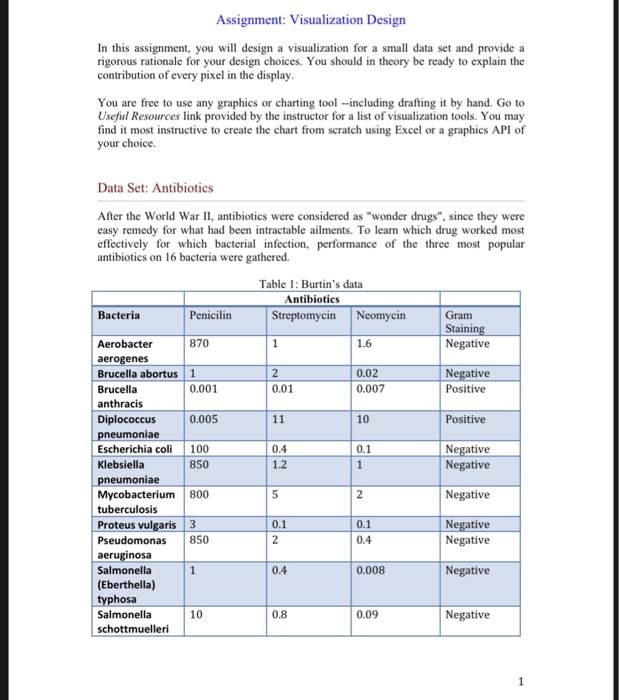
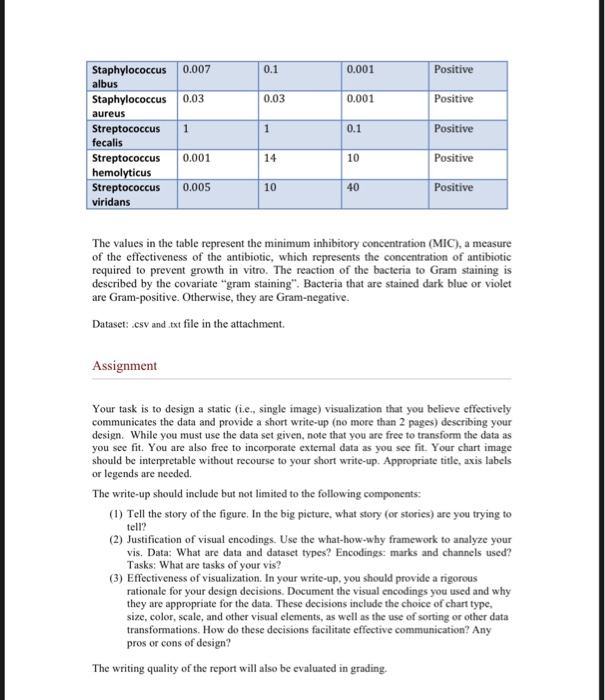
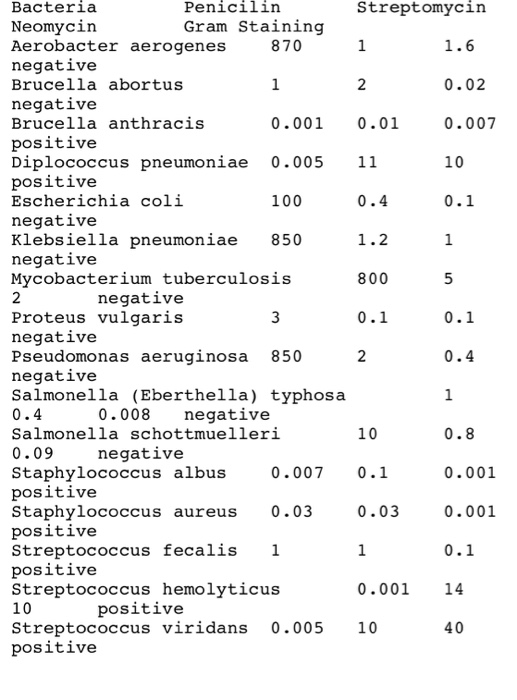
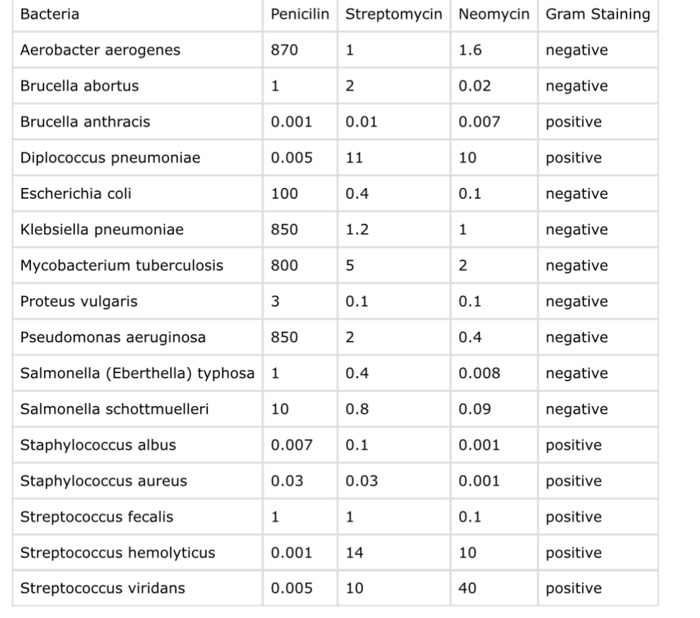
Assignment: Visualization Design In this assignment, you will design a visualization for a smal data set and provide a rigorous rationale for your design choices. You should in theory be ready to explain the contribution of every pixel in the display You are free to use any graphics or charting tool -including drafting it by hand. Go to Useful Resources link provided by the instructor for a list of visualization tools. You may find it most instructive to create the chart from scratch using Excel or a graphics API of your choice Data Set: Antibiotics After the World War II, antibiotics were considered as "wonder drugs", since they were easy remedy for what had been intractable ailments. To learn which drug worked most effectively for which bacterial infection, performance of the three most popular antibiotics on 16 bacteria were gathered. Table 1:Burtin's data Antibiotics Bacteria Penicilin Gram 870 1.6 Negative Aerobacter erogenes Brucella abortus 1 Brucella 0.02 0.007 Negative Positive 0.001 0.01 Diplococcus 0.005 Positive ae Escherichia coli 100 Klebsiella 0.4 1.2 0.1 Negative Negative Negative Negative 850 Mycobacterium 800 tuberculosis 0.1 0.4 Proteus vulgaris 3 0.1 Negative aeruginosa Salmonella (Eberthella) typhosa Salmonella 0.4 0.008 Negative 10 0.8 0.09 Negative 0.1 0.001 0.001 0.1 10 Positive Positive Positive Positive Positive Staphylococcus 0.007 albus Staphylococcus 0.03 aureus Streptococcus 1 fecalis Streptococcus 0.001 0.03 icus Streptococcus 0.005 viridans 40 The values in the table represent the minimum inhibitory concentration (MIC), a measure of the effectiveness of the antibiotic, which represents the concentration of antibiotic required to prevent growth in vitro. The reaction of the bacteria to Gram staining is described by the covariate "gram staining". Bacteria that are stained dark blue or violet are Gram-positive. Otherwise, they are Gram-negative. Dataset: .csv and txt file in the attachment. Assignment Your task is to design a static (i.e, single image) visualization that you believe effectively communicates the data and provide a short write-up (no more than 2 pages) describing your design. While you must use the data set given, note that you are free to transform the data as you see fit. You are also free to incorporate extermal data as you see fit. Your chart image should be interpretable without recourse to your short write-up. Appropriate title, axis labels or legends are needed. The write-up should include but not limited to the following components: (1) Tell the story of the figure. In the big picture, what story (or stories) are you trying to tell? (2) Justification of visual encodings. Use the what-how-why framework to analyze your vis. Data: What are data and dataset types? Encodings: marks and channels used? Tasks: What are tasks of your vis? (3) Effectiveness of visualization. In your write-up, you should provide a rigorous rationale for your design decisions. Document the visual encodings you used and why they are appropriate for the data. These decisions include the choice of chart type, size, color, scale, and other visual elements, as well as the use of sorting or other data transformations. How do these decisions facilitate effective communication? Any pros or cons of design? The writing quality of the report will also be evaluated in grading. Bacteria Neomycin Aerobacter aerogenes negative Brucella abortus negative Brucella anthracis positive Diplococcus pneumoniae 0.005 11 positive Escherichia coli negative Klebsiella pneumoniae 850 negative Mycobacterium tuberculosis 2 Proteus vulgaris negative Pseudomonas aeruginosa 850 negative Salmonella (Eberthella) typhosa 0.4 Salmonella schottmuelleri 0.09 Staphylococcus albus positive Staphylococcus aureus 0.03 positive Streptococcus fecalis 1 positive Streptococcus hemolyticus 10 Streptococcus viridans 0.005 10 positive Penicilin Gram Staining Streptomycin 870 0.02 0.007 10 0.001 0.01 100 800 0.1 2 negative 0.1 0.4 0.008 negative 10 negative 0.0070.1 0.001 0.03 0.001 0.00 14 positive 40 Bacteria Aerobacter aerogenes Brucella abortus Brucella anthracis Diplococcus pneumoniae Escherichia coli Klebsiella pneumoniae Mycobacterium tuberculosis Proteus vulgaris Pseudomonas aeruginosa Salmonella (Eberthella) typhosa 1 Salmonella schottmuelleri Staphylococcus albus Staphylococcus aureus Streptococcus fecalis Streptococcus hemolyticus Streptococcus viridans Penicilin Streptomycin Neomycin Gram Staining 870 1.6 0.02 0.007 10 0.1 negative negative positive positive negative negative negative negative negative negative negative positive positive positive positive positive 0.001 0.01 0.005 11 100 850 800 3 850 0.4 1.2 5 0.1 2 0.4 0.8 2 0.1 0.4 0.008 0.09 0.001 0.001 0.1 10 40 10 0.007 0.1 0.03 0.03 0.00 14 0.005 10 Assignment: Visualization Design In this assignment, you will design a visualization for a smal data set and provide a rigorous rationale for your design choices. You should in theory be ready to explain the contribution of every pixel in the display You are free to use any graphics or charting tool -including drafting it by hand. Go to Useful Resources link provided by the instructor for a list of visualization tools. You may find it most instructive to create the chart from scratch using Excel or a graphics API of your choice Data Set: Antibiotics After the World War II, antibiotics were considered as "wonder drugs", since they were easy remedy for what had been intractable ailments. To learn which drug worked most effectively for which bacterial infection, performance of the three most popular antibiotics on 16 bacteria were gathered. Table 1:Burtin's data Antibiotics Bacteria Penicilin Gram 870 1.6 Negative Aerobacter erogenes Brucella abortus 1 Brucella 0.02 0.007 Negative Positive 0.001 0.01 Diplococcus 0.005 Positive ae Escherichia coli 100 Klebsiella 0.4 1.2 0.1 Negative Negative Negative Negative 850 Mycobacterium 800 tuberculosis 0.1 0.4 Proteus vulgaris 3 0.1 Negative aeruginosa Salmonella (Eberthella) typhosa Salmonella 0.4 0.008 Negative 10 0.8 0.09 Negative 0.1 0.001 0.001 0.1 10 Positive Positive Positive Positive Positive Staphylococcus 0.007 albus Staphylococcus 0.03 aureus Streptococcus 1 fecalis Streptococcus 0.001 0.03 icus Streptococcus 0.005 viridans 40 The values in the table represent the minimum inhibitory concentration (MIC), a measure of the effectiveness of the antibiotic, which represents the concentration of antibiotic required to prevent growth in vitro. The reaction of the bacteria to Gram staining is described by the covariate "gram staining". Bacteria that are stained dark blue or violet are Gram-positive. Otherwise, they are Gram-negative. Dataset: .csv and txt file in the attachment. Assignment Your task is to design a static (i.e, single image) visualization that you believe effectively communicates the data and provide a short write-up (no more than 2 pages) describing your design. While you must use the data set given, note that you are free to transform the data as you see fit. You are also free to incorporate extermal data as you see fit. Your chart image should be interpretable without recourse to your short write-up. Appropriate title, axis labels or legends are needed. The write-up should include but not limited to the following components: (1) Tell the story of the figure. In the big picture, what story (or stories) are you trying to tell? (2) Justification of visual encodings. Use the what-how-why framework to analyze your vis. Data: What are data and dataset types? Encodings: marks and channels used? Tasks: What are tasks of your vis? (3) Effectiveness of visualization. In your write-up, you should provide a rigorous rationale for your design decisions. Document the visual encodings you used and why they are appropriate for the data. These decisions include the choice of chart type, size, color, scale, and other visual elements, as well as the use of sorting or other data transformations. How do these decisions facilitate effective communication? Any pros or cons of design? The writing quality of the report will also be evaluated in grading. Bacteria Neomycin Aerobacter aerogenes negative Brucella abortus negative Brucella anthracis positive Diplococcus pneumoniae 0.005 11 positive Escherichia coli negative Klebsiella pneumoniae 850 negative Mycobacterium tuberculosis 2 Proteus vulgaris negative Pseudomonas aeruginosa 850 negative Salmonella (Eberthella) typhosa 0.4 Salmonella schottmuelleri 0.09 Staphylococcus albus positive Staphylococcus aureus 0.03 positive Streptococcus fecalis 1 positive Streptococcus hemolyticus 10 Streptococcus viridans 0.005 10 positive Penicilin Gram Staining Streptomycin 870 0.02 0.007 10 0.001 0.01 100 800 0.1 2 negative 0.1 0.4 0.008 negative 10 negative 0.0070.1 0.001 0.03 0.001 0.00 14 positive 40 Bacteria Aerobacter aerogenes Brucella abortus Brucella anthracis Diplococcus pneumoniae Escherichia coli Klebsiella pneumoniae Mycobacterium tuberculosis Proteus vulgaris Pseudomonas aeruginosa Salmonella (Eberthella) typhosa 1 Salmonella schottmuelleri Staphylococcus albus Staphylococcus aureus Streptococcus fecalis Streptococcus hemolyticus Streptococcus viridans Penicilin Streptomycin Neomycin Gram Staining 870 1.6 0.02 0.007 10 0.1 negative negative positive positive negative negative negative negative negative negative negative positive positive positive positive positive 0.001 0.01 0.005 11 100 850 800 3 850 0.4 1.2 5 0.1 2 0.4 0.8 2 0.1 0.4 0.008 0.09 0.001 0.001 0.1 10 40 10 0.007 0.1 0.03 0.03 0.00 14 0.005 10
Step by Step Solution
There are 3 Steps involved in it

Get step-by-step solutions from verified subject matter experts