

Question: Assignment2- Creating a simple decision-making tool. In this exercise, students will work in pairs and create a simple decision-making tool using Microsoft excel. Students are
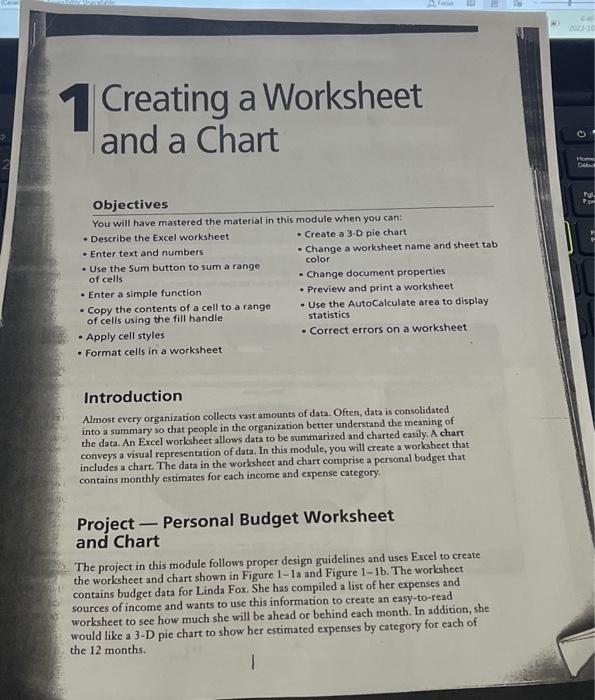
Assignment2-Creating a simple decision-making tool. In this exercise, students will work in pairs and create a simple decision-making tool using Microsoft | excel. Students are required to the steps distributed in class. Depending on the version of excel you are using, you may have to make some adjustments. After construction of the tool, answer the following questions. 1.How easy/difficult was it constructing the tool? 2. List and briefly explain five things that can be learned or deduced from this tool in decision making. Answers: Creating a Worksheet and a Chart Objectives You will have mastered the material in this module when you can: - Describe the Excel worksheet - Enter text and numbers - Use the Sum button to sum a range of cells - Enter a simple function - Copy the contents of a cell to a range of cells using the fill handle - Apply cell styles - Format cells in a worksheet - Create a 3-D pie chart - Change a worksheet name and sheet tab color - Change document properties - Preview and print a worksheet - Use the AutoCalculate area to display statistics - Correct errors on a worksheet Introduction Almost every organization collects vast amounts of data. Often, data is consolidated into a summary so that people in the organization better understand the meaning of the data. An Excel worksheet allows data to be summarized and charted easily. A chart conveys a visual representation of data. In this module, you will create a workshect that includes a chart. The data in the worksheet and chart comprise a personal budget that contains monthly estimates for each income and expense category. Project - Personal Budget Worksheet and Chart The project in this module follows proper design guidelines and uses Excel to create the worksheet and chart shown in Figure 1- la and Figure 1-1b. The worksheet contains budget data for Linda Fox. She has compiled a list of her expenses and sources of income and wants to use this information to create an easy-to-read worksheet to see how much she will be ahead or behind each month. In addition, she would like a 3-D pie chart to show her estimated expenses by category for each of the 12 months
Step by Step Solution
There are 3 Steps involved in it

Get step-by-step solutions from verified subject matter experts