

Question: Assignments_v.1.0.2 (4) (Protected View) - Word Konishak esign Layout References Mailings Review View Help Tell me what you want to do 3. The table below
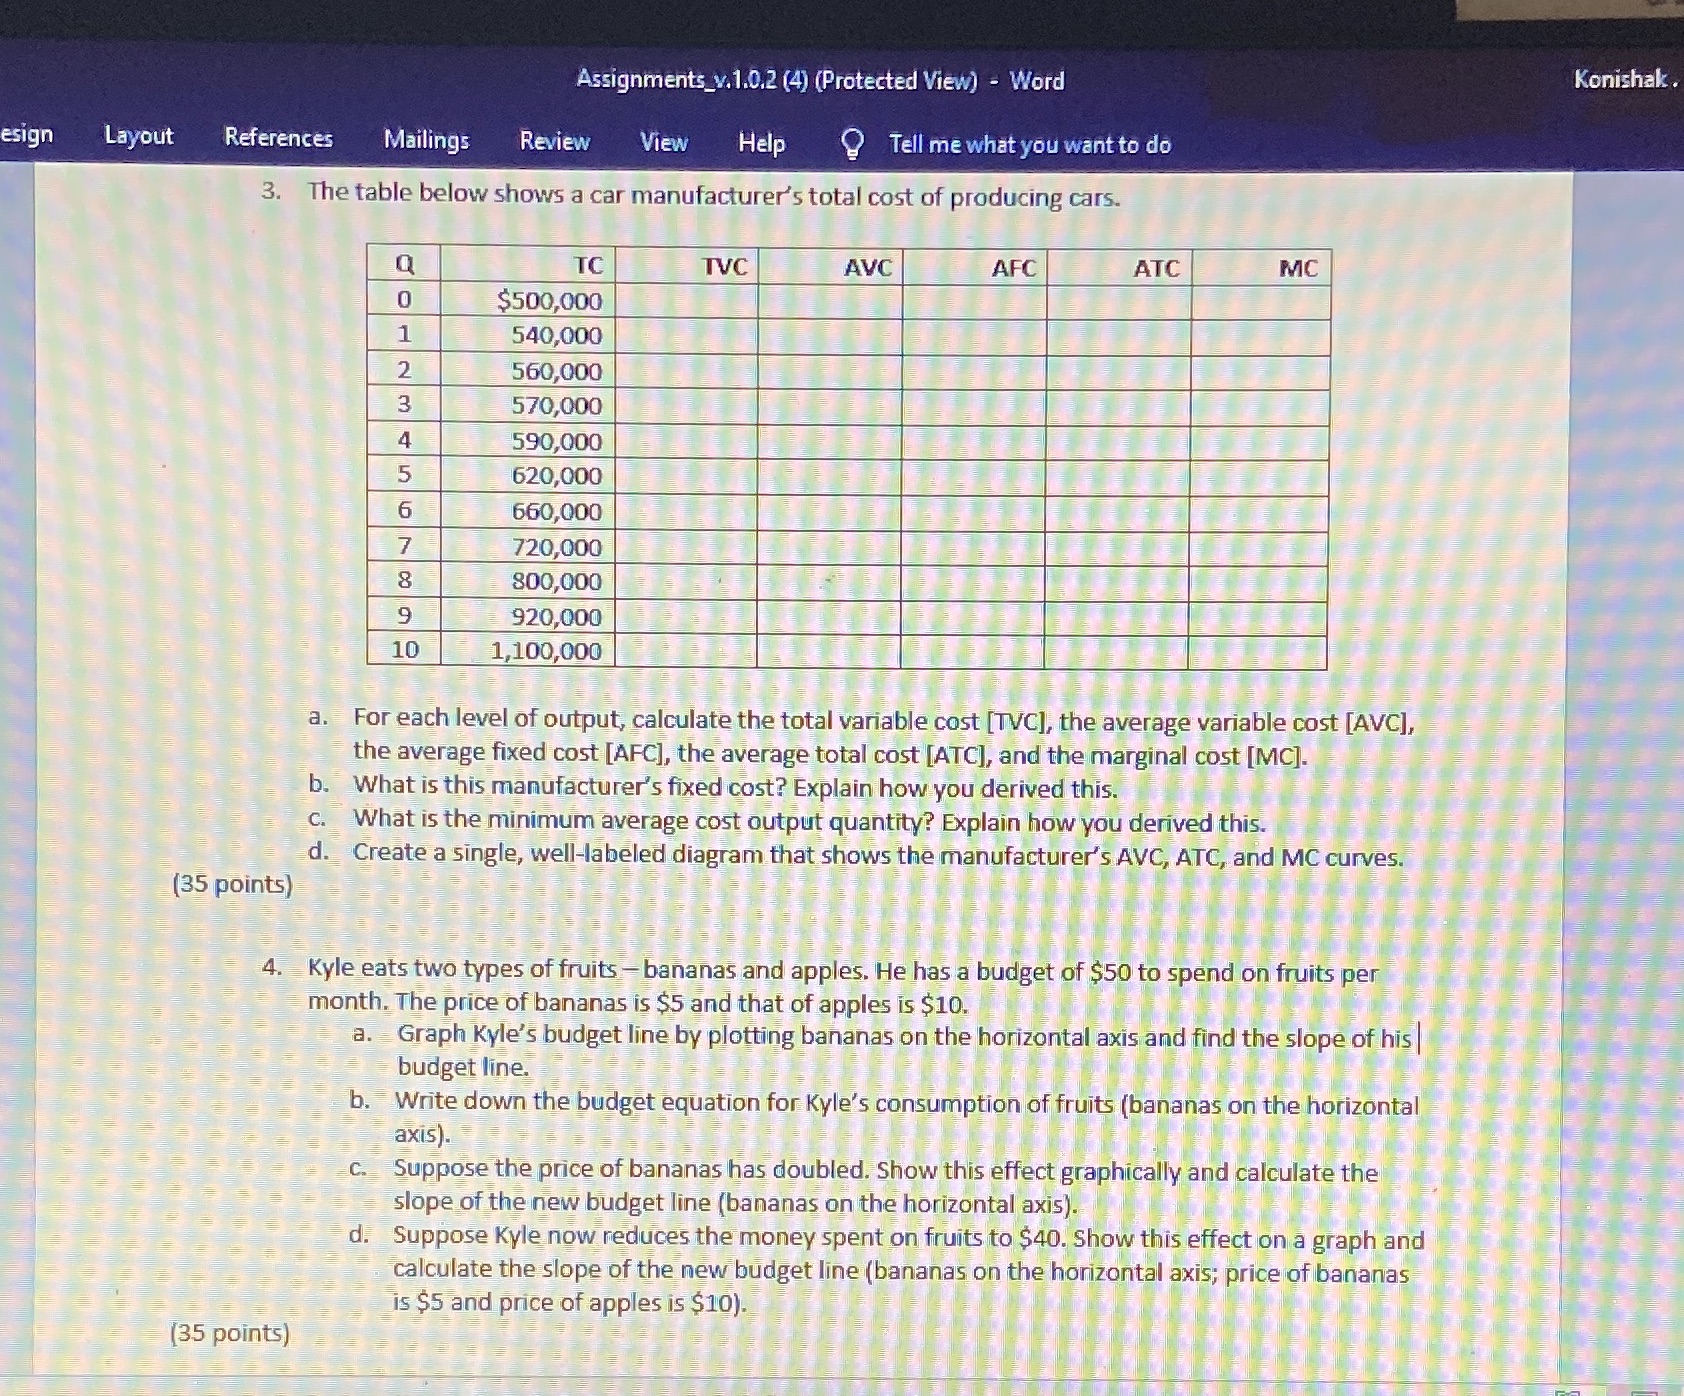
Assignments_v.1.0.2 (4) (Protected View) - Word Konishak esign Layout References Mailings Review View Help Tell me what you want to do 3. The table below shows a car manufacturer's total cost of producing cars. a TC TVC AVC AFC ATC MC 0 $500,000 1 540,000 2 560,000 3 570,000 4 590,000 5 620,000 6 660,000 7 720,000 8 800,000 9 920,000 10 1,100,000 a. For each level of output, calculate the total variable cost [TVC], the average variable cost [AVC], the average fixed cost [AFC], the average total cost [ATC], and the marginal cost [MC]. b. What is this manufacturer's fixed cost? Explain how you derived this. C. What is the minimum average cost output quantity? Explain how you derived this. d. Create a single, well-labeled diagram that shows the manufacturer's AVC, ATC, and MC curves. (35 points) 4. Kyle eats two types of fruits - bananas and apples. He has a budget of $50 to spend on fruits per month. The price of bananas is $5 and that of apples is $10. a. Graph Kyle's budget line by plotting bananas on the horizontal axis and find the slope of his| budget line. Write down the budget equation for Kyle's consumption of fruits (bananas on the horizontal axis). Suppose the price of bananas has doubled. Show this effect graphically and calculate the slope of the new budget line (bananas on the horizontal axis). Suppose Kyle now reduces the money spent on fruits to $40. Show this effect on a graph and calculate the slope of the new budget line (bananas on the horizontal axis; price of bananas is $5 and price of apples is $10). (35 points)
Step by Step Solution
There are 3 Steps involved in it

Get step-by-step solutions from verified subject matter experts