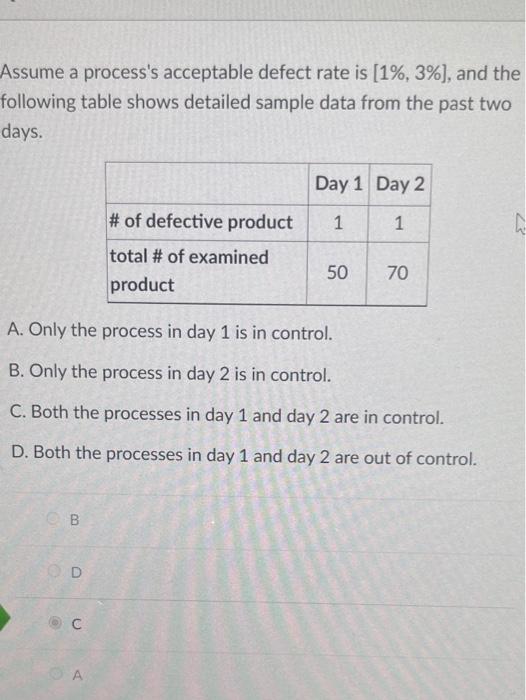
Question: Assume a process's acceptable defect rate is [1%, 3%], and the following table shows detailed sample data from the past two days. Day 1 Day

Assume a process's acceptable defect rate is [1%,
Assume a process's acceptable defect rate is [1%, 3%], and the following table shows detailed sample data from the past two days. Day 1 Day 2 # of defective product 1 1 NE total # of examined product 50 70 A. Only the process in day 1 is in control. B. Only the process in day 2 is in control. C. Both the processes in day 1 and day 2 are in control. D. Both the processes in day 1 and day 2 are out of control. D A Assume an established quality control chart are as follows: X-bar chart is [150, 170], and R-chart is [20, 60). A sample of six performance data were recorded: 140, 125, 110, 145, 156 and 120. Based on the information of sample mean and sample range, and the assumed established control chart, please determine whether the sample process is in control or not. A. Yes, the process is in control. B. No, the process is out of control, because X-bar chart alone is not satisfied. C. No, the process is out of control, because R chart alone is not satisfied. D. No, the process is out of control, because both X-bar chart and R chart are not satisfied. A D

Step by Step Solution

There are 3 Steps involved in it

1 Expert Approved Answer
Step: 1 Unlock blur-text-image
Question Has Been Solved by an Expert!

Get step-by-step solutions from verified subject matter experts

Step: 2 Unlock
Step: 3 Unlock

Students Have Also Explored These Related General Management Questions!