

Question: Assume that a randomly selected subject is given a bone density test. Those test scores are normally distributed with a mean of 0 and a
Assume that a randomly selected subject is given a bone density test. Those test scores are normally distributed with a mean of and a standard deviation of Draw a graph and find the bone density test scores that can be used as cutoff values separating the lowest and highest indicating levels that are too low or too high, respectively.
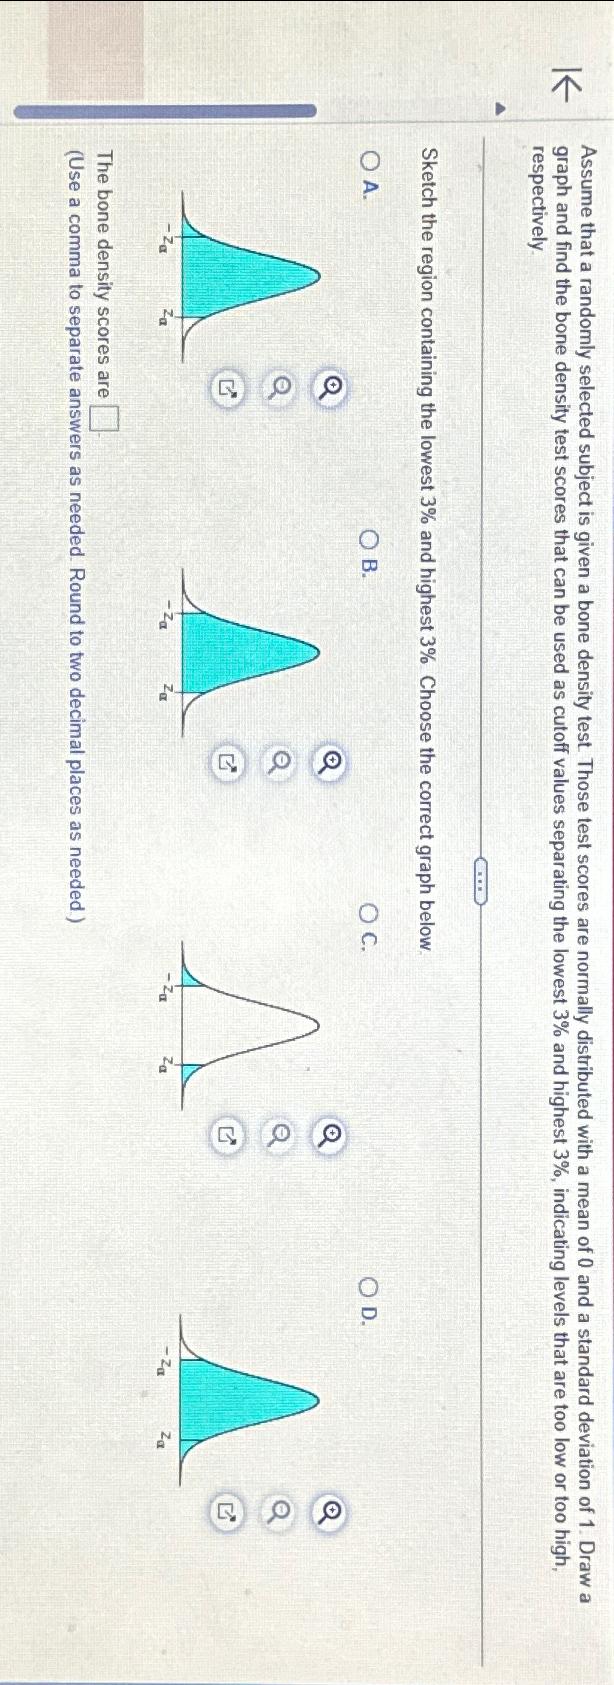
Sketch the region containing the lowest and highest Choose the correct graph below.
A
B
C
D
The bone density scores are
Use a comma to separate answers as needed. Round to two decimal places as needed
Step by Step Solution
There are 3 Steps involved in it
1 Expert Approved Answer
Step: 1 Unlock

Question Has Been Solved by an Expert!
Get step-by-step solutions from verified subject matter experts
Step: 2 Unlock
Step: 3 Unlock