

Question: Assume that a randomly selected subject is given a bone density test. Bone density test scores are normally distributed with a mean oft) and a
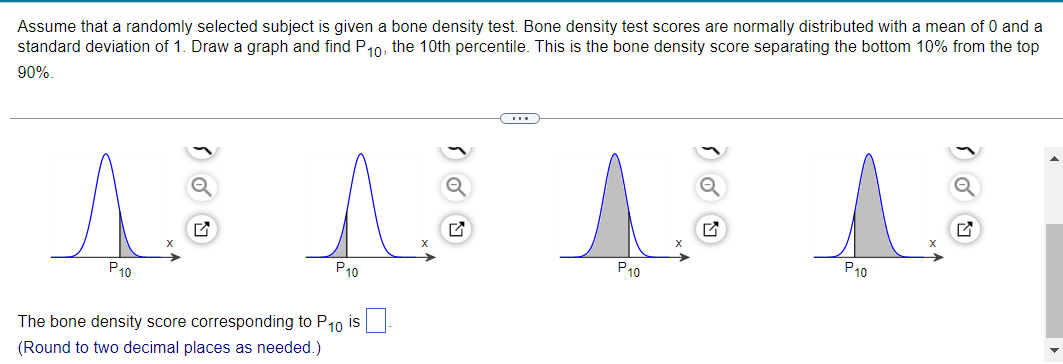
Assume that a randomly selected subject is given a bone density test. Bone density test scores are normally distributed with a mean oft) and a standard deviation of 1. Draw a graph and find P10, the 10th percentile. This is the bone density score separating the bottom 10% from the top 90%. '\"N "\\ "\\ --\\ A Q Q Q Q l3 l3 I3 l3 X X X X P10 P10 F'10 P10 The bone density score corresponding to P10 is (Round to two decimal places as needed.) 7
Step by Step Solution
There are 3 Steps involved in it
1 Expert Approved Answer
Step: 1 Unlock

Question Has Been Solved by an Expert!
Get step-by-step solutions from verified subject matter experts
Step: 2 Unlock
Step: 3 Unlock