

Question: Assume that a randomly selected subject is given a bone density test. Bone density test scores are normally distributed with a mean of 0 and
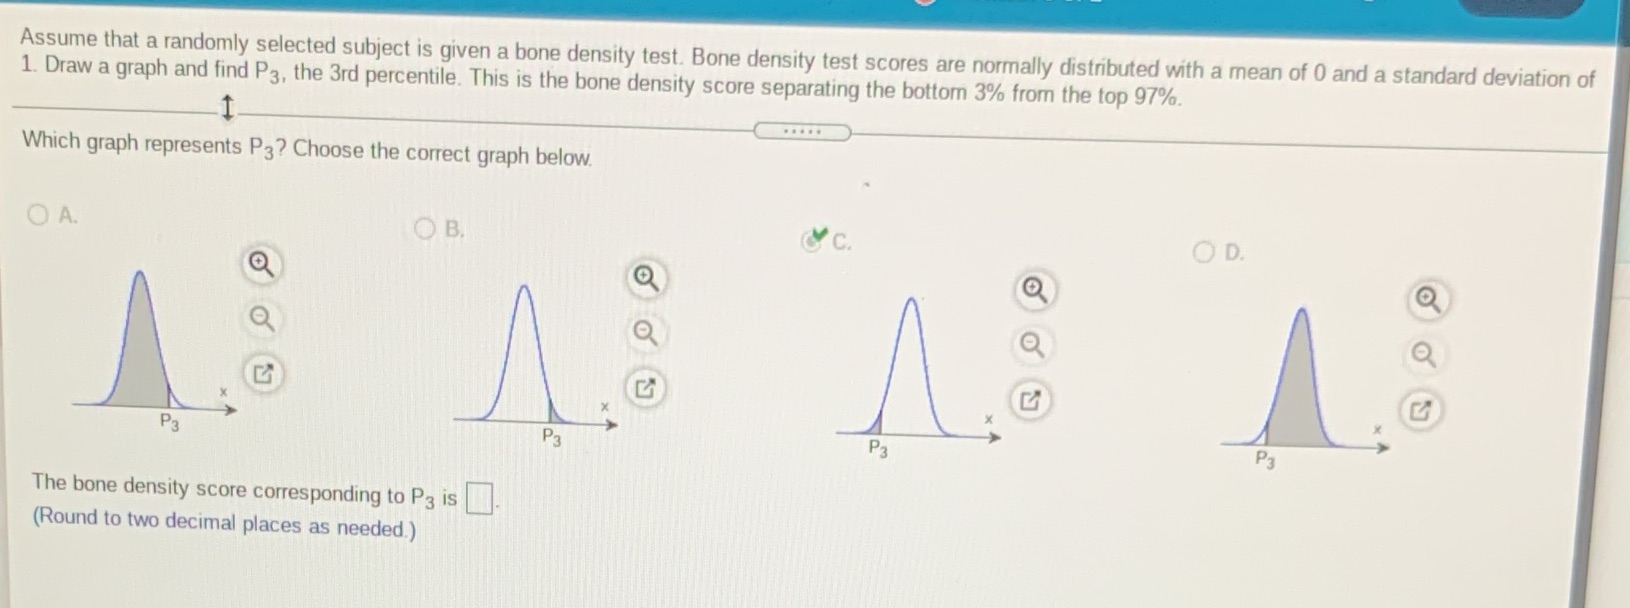
Assume that a randomly selected subject is given a bone density test. Bone density test scores are normally distributed with a mean of 0 and a standard deviation of 1. Draw a graph and find P3, the 3rd percentile. This is the bone density score separating the bottom 3% from the top 97%. Which graph represents P3? Choose the correct graph below. O A. OB. &C. OD. O O Q X P3 P3 P3 P3 The bone density score corresponding to P3 is (Round to two decimal places as needed.)
Step by Step Solution
There are 3 Steps involved in it
1 Expert Approved Answer
Step: 1 Unlock

Question Has Been Solved by an Expert!
Get step-by-step solutions from verified subject matter experts
Step: 2 Unlock
Step: 3 Unlock