

Question: assume that here A=8, B=1, C=1 . Based on this information find. a) Construct a scatter plot of these data. Does the scatter diagram exhibit
assume that here A=8, B=1, C=1 . Based on this information find. a) Construct a scatter plot of these data. Does the scatter diagram exhibit a linear relationship between the amount of sugar and the number of calories per serving?b) Calculate the Person's coefficient of correlation. c) Find the predictive regression equation of the number of calories on the amount of sugar.d) Give a brief interpretation of the values of a and b calculated in part c.e) Calculate the predicted calorie count for a cereal with 16 grams of sugar per serving.f) Estimate the calorie count for a cereal with 52 grams of sugar per serving. Comment on this finding.g) Calculate the residual error.
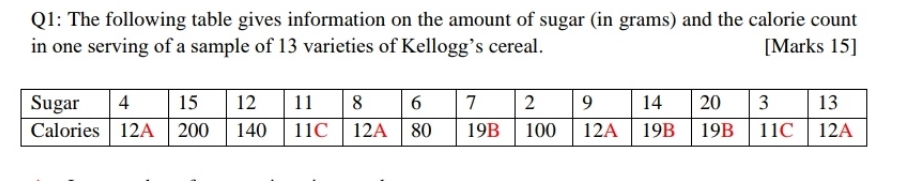
Q1: The following table gives information on the amount of sugar (in grams) and the calorie count in one serving of a sample of 13 varieties of Kellogg's cereal. [Marks 15] Sugar 4 15 12 11 8 6 7 2 9 14 20 3 13 Calories 12A 200 140 11C 12A 80 19B 100 12A 19B 19B 11C 12A
Step by Step Solution
There are 3 Steps involved in it

Get step-by-step solutions from verified subject matter experts