

Question: Assume that it is possible to increase the processing time for machine 1 from the current level of 80 hours a week to 100 hours
Assume that it is possible to increase the processing time for machine 1 from the current level of 80 hours a week to 100 hours a week. Use 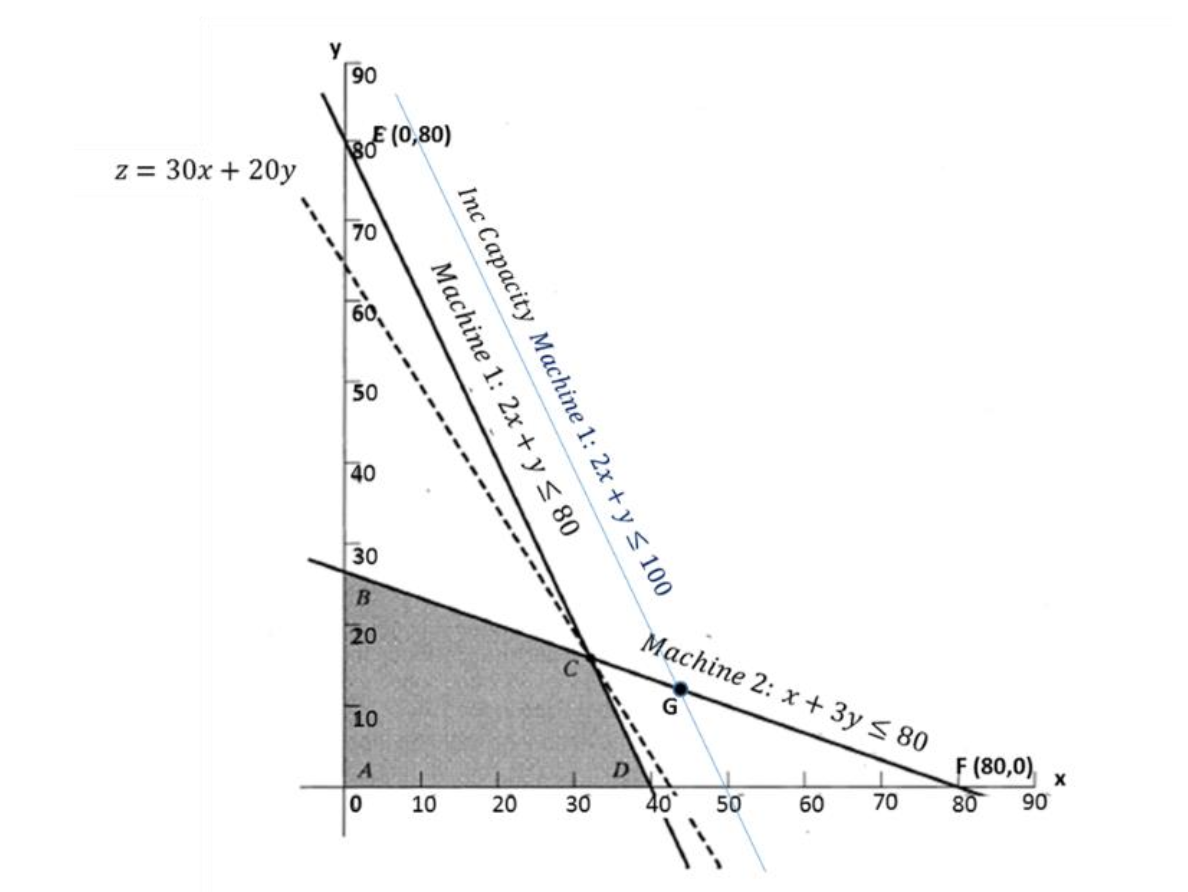 the graph in Figure 2(below)to determine the optimal solution: which of the points A-G represents the optimal mix? What is the optimal value of xand y? What is the optimal objective value?
Step by Step Solution
There are 3 Steps involved in it
1 Expert Approved Answer
Step: 1 Unlock

Question Has Been Solved by an Expert!
Get step-by-step solutions from verified subject matter experts
Step: 2 Unlock
Step: 3 Unlock