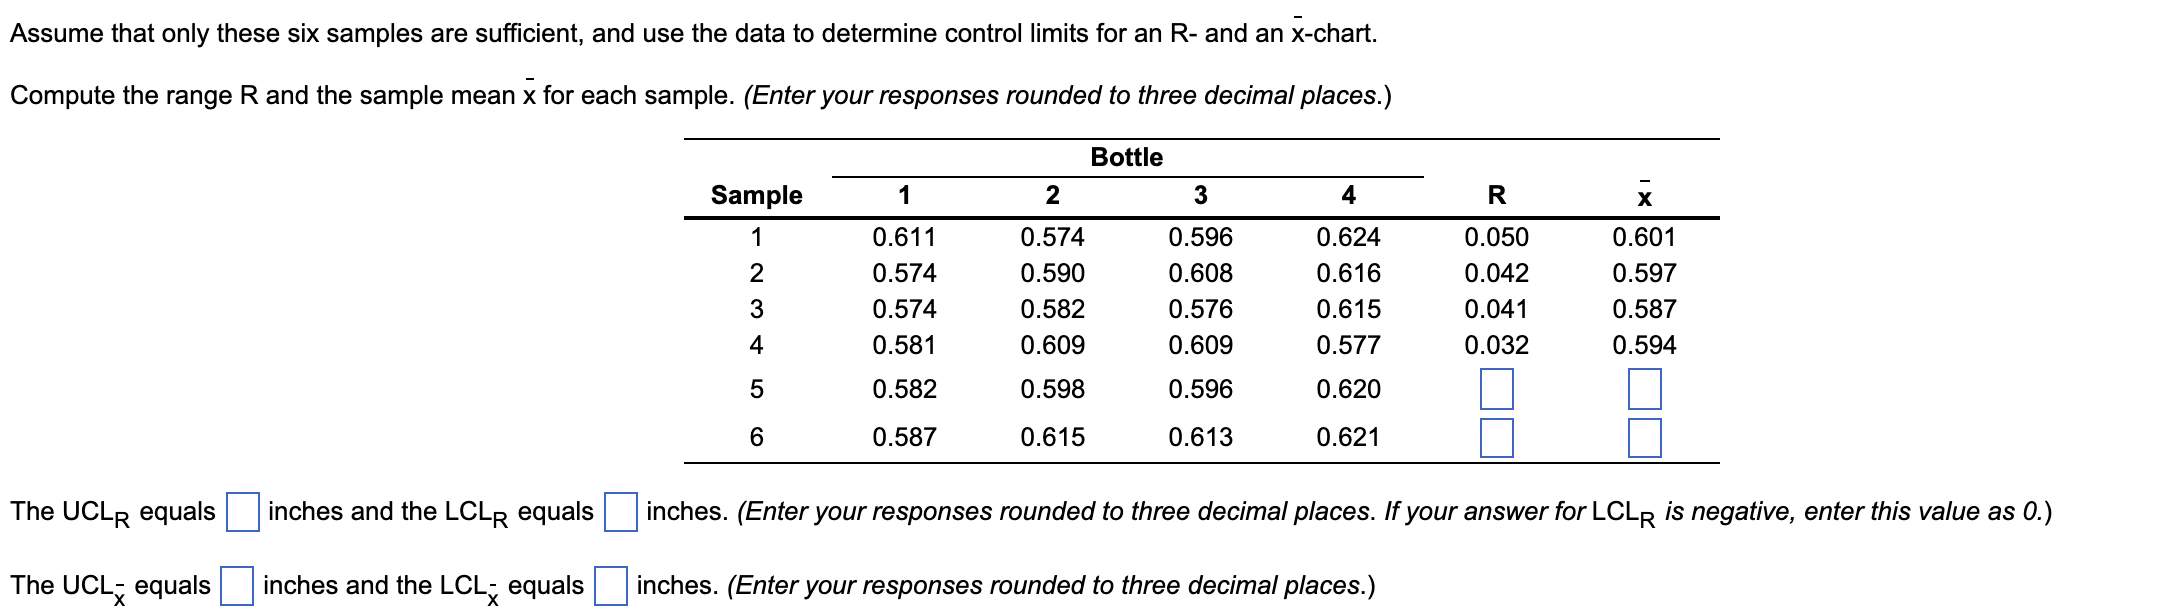
Question: Assume that only these six samples are sufficient, and use the data to determine control limits for an R- and an X-chart. Compute the range

Assume that only these six samples are

Assume that only these six samples are

Assume that only these six samples are

Assume that only these six samples are sufficient, and use the data to determine control limits for an R- and an X-chart. Compute the range R and the sample mean x for each sample. (Enter your responses rounded to three decimal places.) Bottle 1 2 3 4 R Sample 1 2 3 4 0.611 0.574 0.574 0.581 0.574 0.590 0.582 0.609 0.596 0.608 0.576 0.609 0.624 0.616 0.615 0.577 0.050 0.042 0.041 0.032 0.601 0.597 0.587 0.594 5 0.582 0.598 0.596 0.620 6 0.587 0.615 0.613 0.621 The UCLR equals inches and the LCLR equals inches. (Enter your responses rounded to three decimal places. If your answer for LCLR is negative, enter this value as 0.) L The UCL, equals inches and the LCLI equals inches. (Enter your responses rounded to three decimal places.) Factors for calculating three-sigma limits for the x-chart and R-chart Size of Sample Factor for UCL and LCL (n) for X-chart (A2) Factor for LCL for R-Chart (D3) Factor for UCL for R-Chart (14) 0 0 0 0 o o voo AWN 1.880 1.023 0.729 0.577 0.483 0.419 0.373 0.337 0.308 0 3.267 2.575 2.282 2.115 2.004 1.924 1.864 1.816 1.777 0.076 0.136 0.184 0.223 10 The UCLR equals inches and the LCLR equals inches. (Enter your responses rounded to three decimal places. If your answer for LCLR is negative, enter this value as 0.) The UCL, equals inches and the LCLE equals inches. (Enter your responses rounded to three decimal places.)

Step by Step Solution

There are 3 Steps involved in it

1 Expert Approved Answer
Step: 1 Unlock blur-text-image
Question Has Been Solved by an Expert!

Get step-by-step solutions from verified subject matter experts

Step: 2 Unlock
Step: 3 Unlock

Students Have Also Explored These Related General Management Questions!