

Question: Assume that the chart below shows the probability (on the vertical y-axis) that a project will complete within X days (X on the horizontal x-axis).
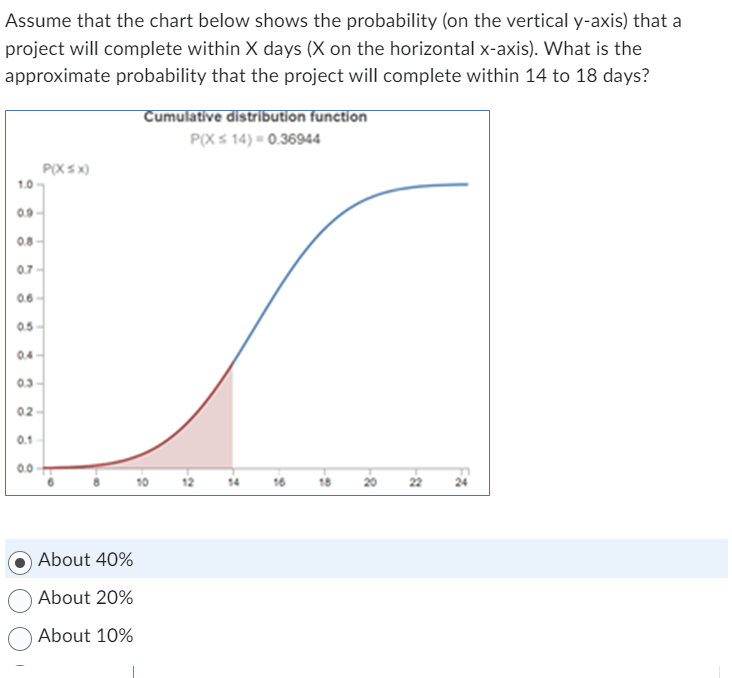
Assume that the chart below shows the probability (on the vertical y-axis) that a project will complete within X days (X on the horizontal x-axis). What is the approximate probability that the project will complete within 14 to 18 days?
SEE TABLE BELOW FOR THE EXERCISE AND PROVIDE RIGHT OPTION FROM THE LIST BELOW
Assume that the chart below shows the probability {on the vertical yaxis] that a project will complete within X clays (X on the horizontal xaxis]. What is the approximate probability that the project will complete within 14 to 18 days? umu Q It one 0\" o 3.69\" I' .It I It} 09 on or 00 as 0-! O) o: 0'. 00 8 3 1? l- 6 u D 3': 3'4 6.) About 40% 0 About 20% 0 About 10% _ |
Step by Step Solution
There are 3 Steps involved in it

Get step-by-step solutions from verified subject matter experts