

Question: Assume that, the data given in Exhibit 3 represents the most recent data over past 17 years. Only for the US market, what would you
Assume that, the data given in Exhibit 3 represents the most recent data over past 17 years. Only for the US market, what would you guess for the market return to be for 2021? In other words, make a guess for the year 2021 using the data given in Exhibit 3.
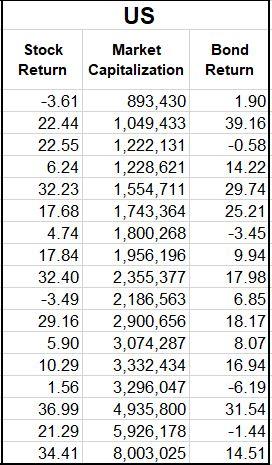
| US | ||
| Stock Return | Market Capitalization | Bond Return |
| -3.61 | 893,430 | 1.90 |
| 22.44 | 1,049,433 | 39.16 |
| 22.55 | 1,222,131 | -0.58 |
| 6.24 | 1,228,621 | 14.22 |
| 32.23 | 1,554,711 | 29.74 |
| 17.68 | 1,743,364 | 25.21 |
| 4.74 | 1,800,268 | -3.45 |
| 17.84 | 1,956,196 | 9.94 |
| 32.40 | 2,355,377 | 17.98 |
| -3.49 | 2,186,563 | 6.85 |
| 29.16 | 2,900,656 | 18.17 |
| 5.90 | 3,074,287 | 8.07 |
| 10.29 | 3,332,434 | 16.94 |
| 1.56 | 3,296,047 | -6.19 |
| 36.99 | 4,935,800 | 31.54 |
| 21.29 | 5,926,178 | -1.44 |
| 34.41 | 8,003,025 | 14.51 |
US Stock Return -3.61 22.44 22.55 6.24 32.23 17.68 4.74 17.84 32.40 -3.49 29.16 5.90 10.29 1.56 36.99 21.29 34.41 Market Bond Capitalization Return 893,430 1.90 1,049,433 39.16 1,222, 131 -0.58 1,228,621 14.22 1,554,711 29.74 1,743,364 25.21 1,800,268 -3.45 1,956, 196 9.94 2,355,377 17.98 2,186,563 6.85 2,900,656 18.17 3,074,287 8.07 3,332,434 16.94 3,296,047 -6.19 4,935,800 31.54 5,926,178 -1.44 8,003,025 14.51 US Stock Return -3.61 22.44 22.55 6.24 32.23 17.68 4.74 17.84 32.40 -3.49 29.16 5.90 10.29 1.56 36.99 21.29 34.41 Market Bond Capitalization Return 893,430 1.90 1,049,433 39.16 1,222, 131 -0.58 1,228,621 14.22 1,554,711 29.74 1,743,364 25.21 1,800,268 -3.45 1,956, 196 9.94 2,355,377 17.98 2,186,563 6.85 2,900,656 18.17 3,074,287 8.07 3,332,434 16.94 3,296,047 -6.19 4,935,800 31.54 5,926,178 -1.44 8,003,025 14.51
Step by Step Solution
There are 3 Steps involved in it

Get step-by-step solutions from verified subject matter experts