

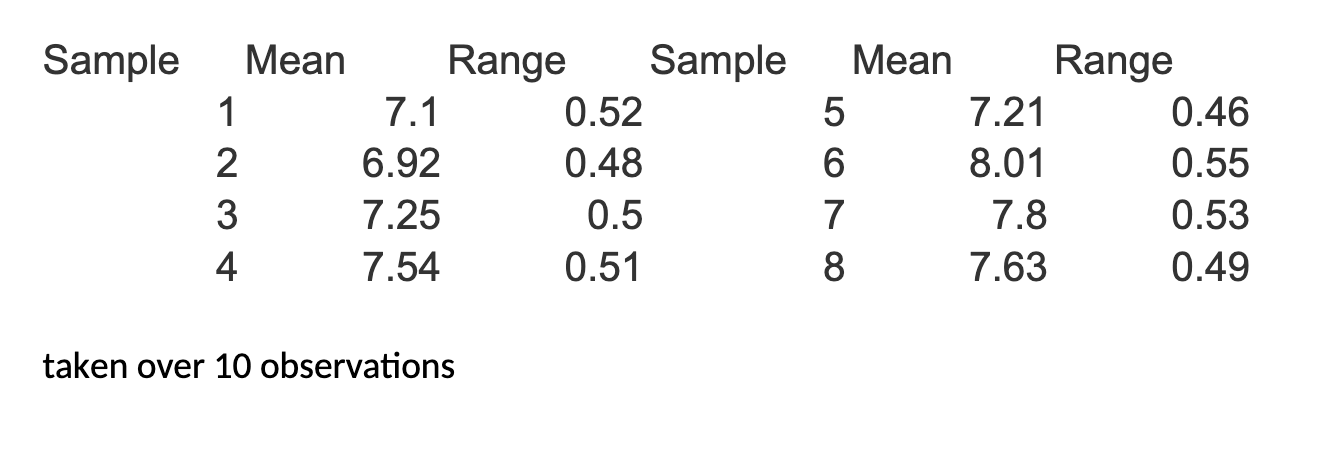
Question: Assume that there were 1 0 observations in each sample. What are the Upper and Lower Control Limits for both the Xbar and R charts?
Assume that there were observations in each sample.
What are the Upper and Lower Control Limits for both the Xbar and R charts?
Is the process in control?
Step by Step Solution
There are 3 Steps involved in it
1 Expert Approved Answer
Step: 1 Unlock

Question Has Been Solved by an Expert!
Get step-by-step solutions from verified subject matter experts
Step: 2 Unlock
Step: 3 Unlock