

Assume that thermometer readings are normally distributed with a mean of 0C and a standard deviation...
Fantastic news! We've Found the answer you've been seeking!
Question:
Transcribed Image Text:
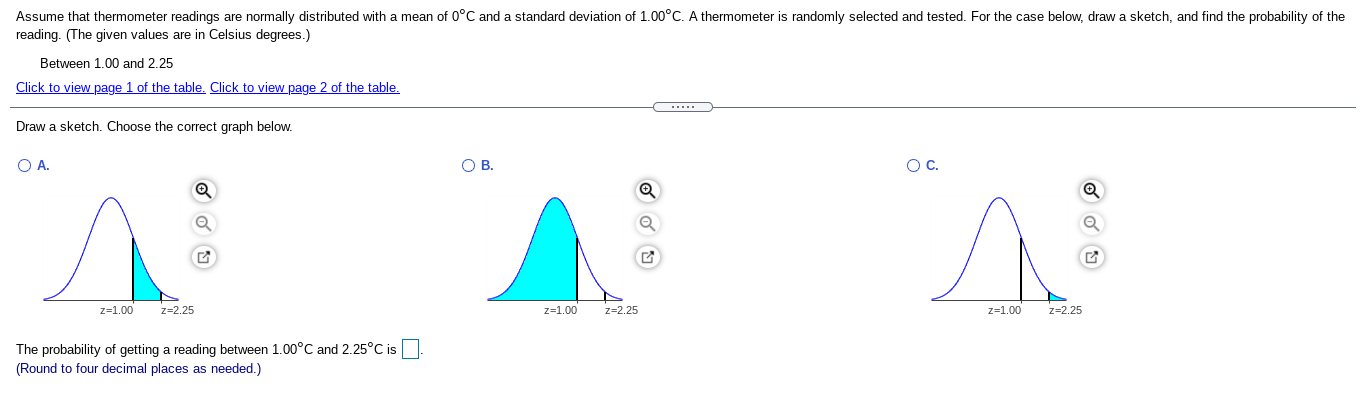
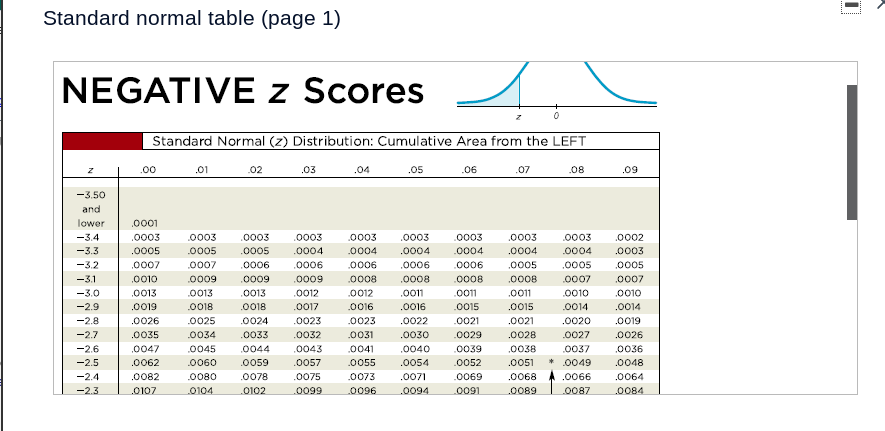
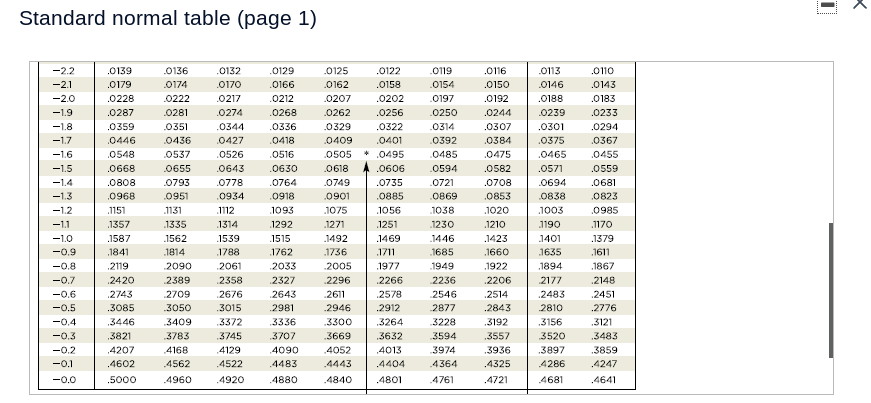
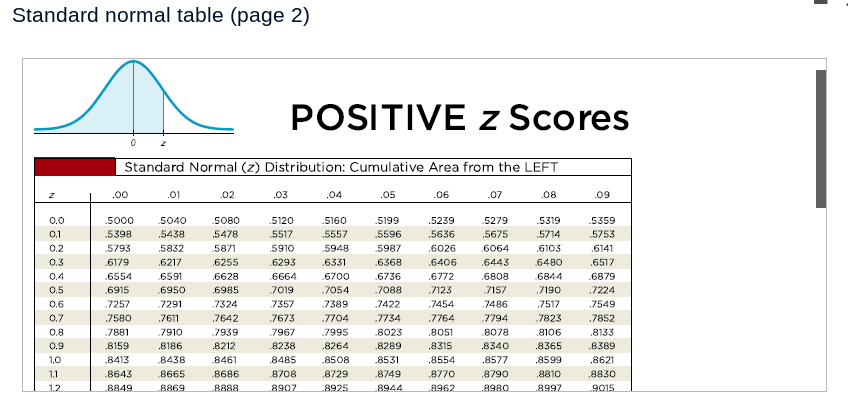
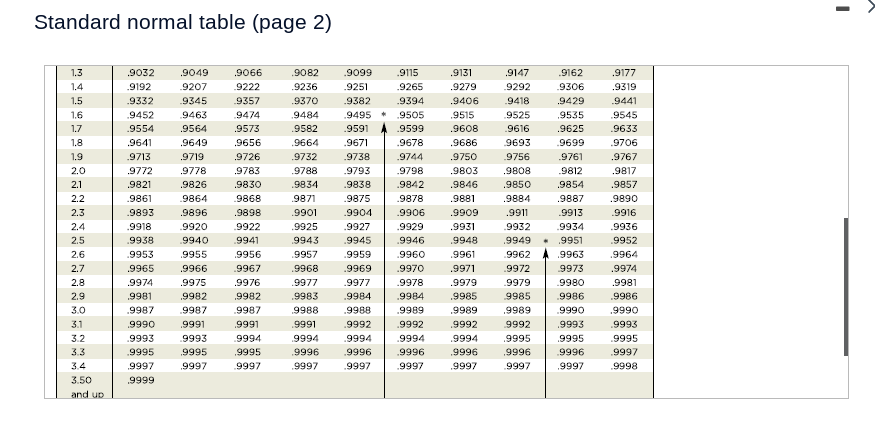
Assume that thermometer readings are normally distributed with a mean of 0C and a standard deviation of 1.00C. A thermometer is randomly selected and tested. For the case below, draw a sketch, and find the probability of the reading. (The given values are in Celsius degrees.) Between 1.00 and 2.25 Click to view page 1 of the table. Click to view page 2 of the table. Draw a sketch. Choose the correct graph below. A. z=1.00 z=2.25 The probability of getting a reading between 1.00C and 2.25C is (Round to four decimal places as needed.) . C. Q z=1.00 z=2.25 G ^ z=1.00 z=2.25 G Standard normal table (page 1) NEGATIVE Z Scores Standard Normal (z) Distribution: Cumulative Area from the LEFT z .00 .01 .02 .03 .04 .05 .06 .07 .08 .09 -3.50 and lower .0001 -3.4 .0003 .0003 .0003 .0003 -3.3 .0005 .0005 .0005 .0004 .0003 .0004 .0003 .0003 .0003 .0003 .0002 .0004 .0004 .0004 .0004 .0003 -3.2 .0007 .0007 .0006 .0006 .0006 .0006 .0006 .0005 .0005 .0005 -3.1 .0010 .0009 .0009 .0009 .0008 .0008 .0008 .0008 .0007 .0007 -3.0 .0013 .0013 .0013 .0012 .0012 .0011 .0011 .0011 .0010 .0010 -2.9 .0019 .0018 .0018 .0017 .0016 .0016 .0015 .0015 .0014 .0014 -2.8 .0026 .0025 .0024 .0023 .0023 .0022 .0021 .0021 .0020 .0019 -2.7 .0035 .0034 .0033 .0032 .0031 .0030 .0029 .0028 .0027 .0026 -2.6 .0047 .0045 .0044 .0043 .0041 .0040 .0039 .0038 .0037 .0036 -2.5 .0062 .0060 .0059 .0057 .0055 .0054 .0052 .0051 * .0049 .0048 -2.4 .0082 .0080 .0078 .0075 .0073 .0071 .0069 .0068 .0066 .0064 -2.3 0107 0104 .0102 .0099 0096 .0094 .0091 .0089 .0087 .0084 Standard normal table (page 1) I x -2.2 .0139 .0136 .0132 .0129 .0125 .0122 .0119 .0116 .0113 .0110 -2.1 .0179 .0174 .0170 .0166 .0162 .0158 0154 .0150 0146 .0143 -2.0 .0228 .0222 .0217 .0212 .0207 .0202 .0197 .0192 .0188 .0183 -1.9 .0287 .0281 .0274 .0268 .0262 .0256 .0250 .0244 .0239 .0233 -1.8 .0359 .0351 .0344 .0336 .0329 .0322 .0314 .0307 .0301 .0294 -1.7 .0446 .0436 .0427 .0418 .0409 .0401 .0392 .0384 .0375 .0367 -1.6 .0548 .0537 .0526 .0516 .0505 * .0495 .0485 .0475 .0465 .0455 -1.5 .0668 .0655 .0643 .0630 .0618 .0606 .0594 .0582 .0571 .0559 -1.4 .0808 .0793 .0778 .0764 .0749 .0735 .0721 .0708 .0694 .0681 -1.3 .0968 .0951 .0934 .0918 .0901 .0885 .0869 .0853 .0838 .0823 -1.2 1151 1131 1112 1093 .1075 1056 1038 1020 1003 .0985 -1.1 .1357 1335 1314 1292 .1271 1251 .1230 1210 1190 .1170 -1.0 .1587 .1562 1539 1515 1492 .1469 1446 1423 1401 1379 -0.9 1841 1814 1788 1762 .1736 1711 1685 .1660 1635 .1611 -0.8 .2119 2090 .2061 .2033 2005 1977 1949 .1922 1894 .1867 -0.7 2420 2389 .2358 .2327 .2296 .2266 2236 .2206 2177 .2148 -0.6 .2743 2709 .2676 .2643 2611 2578 2546 .2514 .2483 .2451 -0.5 .3085 .3050 3015 .2981 .2946 .2912 2877 .2843 2810 .2776 -0.4 .3446 3409 .3372 .3336 .3300 .3264 3228 .3192 .3156 .3121 -0.3 .3821 .3783 .3745 .3707 .3669 .3632 3594 .3557 3520 .3483 -0.2 .4207 4168 .4129 4090 .4052 .4013 3974 .3936 .3897 .3859 -0.1 .4602 .4562 .4522 .4483 .4443 .4404 .4364 .4325 4286 .4247 -0.0 .5000 .4960 .4920 .4880 .4840 .4801 .4761 .4721 4681 .4641 Standard normal table (page 2) POSITIVE z Scores Standard Normal (z) Distribution: Cumulative Area from the LEFT N .00 .01 .02 .03 .04 .05 .06 .07 .08 .09 0.0 .5000 5040 5080 .5120 .5160 .5199 .5239 5279 .5319 .5359 0.1 = .5398 .5438 .5478 .5517 .5557 .5596 .5636 .5675 .5714 .5753 0.2 .5793 .5832 .5871 5910 .5948 .5987 .6026 .6064 .6103 .6141 0.3 .6179 .6217 .6255 .6293 .6331 .6368 .6406 .6443 .6480 .6517 0.4 .6554 .6591 .6628 .6664 .6700 .6736 .6772 .6808 .6844 .6879 0.5 .6915 .6950 .6985 .7019 .7054 .7088 .7123 .7157 .7190 .7224 0.6 .7257 .7291 .7324 .7357 .7389 .7422 .7454 .7486 .7517 .7549 0.7 .7580 .7611 .7642 .7673 .7704 .7734 .7764 .7794 .7823 .7852 0.8 .7881 7910 .7939 .7967 .7995 .8023 .8051 .8078 .8106 .8133 0.9 .8159 .8186 .8212 .8238 .8264 .8289 .8315 .8340 .8365 .8389 1.0 .8413 8438 8461 .8485 .8508 .8531 .8554 .8577 .8599 .8621 1.1 .8643 .8665 .8686 .8708 .8729 .8749 .8770 .8790 .8810 .8830 1.2 8849 8869 8888 8907 8925 8944 .8962 8980 .8997 9015 Standard normal table (page 2) MASSTR222222222223 3 3 3 3 NNNN 1.3 .9032 .9049 .9066 .9082 .9099 .9115 .9131 .9147 .9162 .9177 1.4 .9192 .9207 .9222 .9236 .9251 .9265 .9279 .9292 .9306 .9319 1.5 .9332 9345 .9357 .9370 .9382 .9394 .9406 .9418 .9429 .9441 1.6 .9452 9463 .9474 9484 .9495 .9505 .9515 9525 .9535 .9545 1.7 .9554 .9564 .9573 .9582 .9591 .9599 .9608 .9616 .9625 .9633 1.8 .9641 .9649 .9656 .9664 .9671 .9678 .9686 9693 .9699 .9706 1.9 .9713 .9719 .9726 .9732 .9738 .9744 .9750 .9756 .9761 .9767 2.0 .9772 .9778 .9783 .9788 .9793 .9798 .9803 .9808 .9812 .9817 2.1 .9821 .9826 .9830 .9834 .9838 .9842 .9846 .9850 .9854 .9857 .9861 .9864 .9868 .9871 .9875 .9878 .9881 .9884 .9887 .9890 .9893 .9896 .9898 .9901 .9904 .9906 .9909 .9911 .9913 .9916 2.4 .9918 .9920 .9922 .9925 .9927 .9929 .9931 .9932 .9934 .9936 2.5 .9938 .9940 .9941 9943 .9945 .9946 .9948 .9949 .9951 .9952 2.6 .9953 .9955 .9956 .9957 .9959 .9960 .9961 .9962 .9963 .9964 2.7 .9965 .9966 .9967 .9968 .9969 .9970 .9971 .9972 9973 .9974 2.8 .9974 .9975 .9976 .9977 .9977 .9978 .9979 9979 .9980 .9981 2.9 .9981 .9982 .9982 .9983 .9984 .9984 .9985 9985 .9986 .9986 3.0 .9987 .9987 .9987 .9988 .9988 .9989 .9989 .9989 .9990 .9990 3.1 .9990 .9991 .9991 .9991 .9992 .9992 .9992 9992 .9993 .9993 3.2 .9993 .9993 .9994 .9994 .9994 .9994 .9994 .9995 .9995 .9995 3.3 .9995 .9995 .9995 .9996 .9996 .9996 .9996 .9996 .9996 .9997 3.4 9997 .9997 .9997 .9997 .9997 .9997 .9997 .9997 .9997 .9998 3.50 .9999 and up Assume that thermometer readings are normally distributed with a mean of 0C and a standard deviation of 1.00C. A thermometer is randomly selected and tested. For the case below, draw a sketch, and find the probability of the reading. (The given values are in Celsius degrees.) Between 1.00 and 2.25 Click to view page 1 of the table. Click to view page 2 of the table. Draw a sketch. Choose the correct graph below. A. z=1.00 z=2.25 The probability of getting a reading between 1.00C and 2.25C is (Round to four decimal places as needed.) . C. Q z=1.00 z=2.25 G ^ z=1.00 z=2.25 G Standard normal table (page 1) NEGATIVE Z Scores Standard Normal (z) Distribution: Cumulative Area from the LEFT z .00 .01 .02 .03 .04 .05 .06 .07 .08 .09 -3.50 and lower .0001 -3.4 .0003 .0003 .0003 .0003 -3.3 .0005 .0005 .0005 .0004 .0003 .0004 .0003 .0003 .0003 .0003 .0002 .0004 .0004 .0004 .0004 .0003 -3.2 .0007 .0007 .0006 .0006 .0006 .0006 .0006 .0005 .0005 .0005 -3.1 .0010 .0009 .0009 .0009 .0008 .0008 .0008 .0008 .0007 .0007 -3.0 .0013 .0013 .0013 .0012 .0012 .0011 .0011 .0011 .0010 .0010 -2.9 .0019 .0018 .0018 .0017 .0016 .0016 .0015 .0015 .0014 .0014 -2.8 .0026 .0025 .0024 .0023 .0023 .0022 .0021 .0021 .0020 .0019 -2.7 .0035 .0034 .0033 .0032 .0031 .0030 .0029 .0028 .0027 .0026 -2.6 .0047 .0045 .0044 .0043 .0041 .0040 .0039 .0038 .0037 .0036 -2.5 .0062 .0060 .0059 .0057 .0055 .0054 .0052 .0051 * .0049 .0048 -2.4 .0082 .0080 .0078 .0075 .0073 .0071 .0069 .0068 .0066 .0064 -2.3 0107 0104 .0102 .0099 0096 .0094 .0091 .0089 .0087 .0084 Standard normal table (page 1) I x -2.2 .0139 .0136 .0132 .0129 .0125 .0122 .0119 .0116 .0113 .0110 -2.1 .0179 .0174 .0170 .0166 .0162 .0158 0154 .0150 0146 .0143 -2.0 .0228 .0222 .0217 .0212 .0207 .0202 .0197 .0192 .0188 .0183 -1.9 .0287 .0281 .0274 .0268 .0262 .0256 .0250 .0244 .0239 .0233 -1.8 .0359 .0351 .0344 .0336 .0329 .0322 .0314 .0307 .0301 .0294 -1.7 .0446 .0436 .0427 .0418 .0409 .0401 .0392 .0384 .0375 .0367 -1.6 .0548 .0537 .0526 .0516 .0505 * .0495 .0485 .0475 .0465 .0455 -1.5 .0668 .0655 .0643 .0630 .0618 .0606 .0594 .0582 .0571 .0559 -1.4 .0808 .0793 .0778 .0764 .0749 .0735 .0721 .0708 .0694 .0681 -1.3 .0968 .0951 .0934 .0918 .0901 .0885 .0869 .0853 .0838 .0823 -1.2 1151 1131 1112 1093 .1075 1056 1038 1020 1003 .0985 -1.1 .1357 1335 1314 1292 .1271 1251 .1230 1210 1190 .1170 -1.0 .1587 .1562 1539 1515 1492 .1469 1446 1423 1401 1379 -0.9 1841 1814 1788 1762 .1736 1711 1685 .1660 1635 .1611 -0.8 .2119 2090 .2061 .2033 2005 1977 1949 .1922 1894 .1867 -0.7 2420 2389 .2358 .2327 .2296 .2266 2236 .2206 2177 .2148 -0.6 .2743 2709 .2676 .2643 2611 2578 2546 .2514 .2483 .2451 -0.5 .3085 .3050 3015 .2981 .2946 .2912 2877 .2843 2810 .2776 -0.4 .3446 3409 .3372 .3336 .3300 .3264 3228 .3192 .3156 .3121 -0.3 .3821 .3783 .3745 .3707 .3669 .3632 3594 .3557 3520 .3483 -0.2 .4207 4168 .4129 4090 .4052 .4013 3974 .3936 .3897 .3859 -0.1 .4602 .4562 .4522 .4483 .4443 .4404 .4364 .4325 4286 .4247 -0.0 .5000 .4960 .4920 .4880 .4840 .4801 .4761 .4721 4681 .4641 Standard normal table (page 2) POSITIVE z Scores Standard Normal (z) Distribution: Cumulative Area from the LEFT N .00 .01 .02 .03 .04 .05 .06 .07 .08 .09 0.0 .5000 5040 5080 .5120 .5160 .5199 .5239 5279 .5319 .5359 0.1 = .5398 .5438 .5478 .5517 .5557 .5596 .5636 .5675 .5714 .5753 0.2 .5793 .5832 .5871 5910 .5948 .5987 .6026 .6064 .6103 .6141 0.3 .6179 .6217 .6255 .6293 .6331 .6368 .6406 .6443 .6480 .6517 0.4 .6554 .6591 .6628 .6664 .6700 .6736 .6772 .6808 .6844 .6879 0.5 .6915 .6950 .6985 .7019 .7054 .7088 .7123 .7157 .7190 .7224 0.6 .7257 .7291 .7324 .7357 .7389 .7422 .7454 .7486 .7517 .7549 0.7 .7580 .7611 .7642 .7673 .7704 .7734 .7764 .7794 .7823 .7852 0.8 .7881 7910 .7939 .7967 .7995 .8023 .8051 .8078 .8106 .8133 0.9 .8159 .8186 .8212 .8238 .8264 .8289 .8315 .8340 .8365 .8389 1.0 .8413 8438 8461 .8485 .8508 .8531 .8554 .8577 .8599 .8621 1.1 .8643 .8665 .8686 .8708 .8729 .8749 .8770 .8790 .8810 .8830 1.2 8849 8869 8888 8907 8925 8944 .8962 8980 .8997 9015 Standard normal table (page 2) MASSTR222222222223 3 3 3 3 NNNN 1.3 .9032 .9049 .9066 .9082 .9099 .9115 .9131 .9147 .9162 .9177 1.4 .9192 .9207 .9222 .9236 .9251 .9265 .9279 .9292 .9306 .9319 1.5 .9332 9345 .9357 .9370 .9382 .9394 .9406 .9418 .9429 .9441 1.6 .9452 9463 .9474 9484 .9495 .9505 .9515 9525 .9535 .9545 1.7 .9554 .9564 .9573 .9582 .9591 .9599 .9608 .9616 .9625 .9633 1.8 .9641 .9649 .9656 .9664 .9671 .9678 .9686 9693 .9699 .9706 1.9 .9713 .9719 .9726 .9732 .9738 .9744 .9750 .9756 .9761 .9767 2.0 .9772 .9778 .9783 .9788 .9793 .9798 .9803 .9808 .9812 .9817 2.1 .9821 .9826 .9830 .9834 .9838 .9842 .9846 .9850 .9854 .9857 .9861 .9864 .9868 .9871 .9875 .9878 .9881 .9884 .9887 .9890 .9893 .9896 .9898 .9901 .9904 .9906 .9909 .9911 .9913 .9916 2.4 .9918 .9920 .9922 .9925 .9927 .9929 .9931 .9932 .9934 .9936 2.5 .9938 .9940 .9941 9943 .9945 .9946 .9948 .9949 .9951 .9952 2.6 .9953 .9955 .9956 .9957 .9959 .9960 .9961 .9962 .9963 .9964 2.7 .9965 .9966 .9967 .9968 .9969 .9970 .9971 .9972 9973 .9974 2.8 .9974 .9975 .9976 .9977 .9977 .9978 .9979 9979 .9980 .9981 2.9 .9981 .9982 .9982 .9983 .9984 .9984 .9985 9985 .9986 .9986 3.0 .9987 .9987 .9987 .9988 .9988 .9989 .9989 .9989 .9990 .9990 3.1 .9990 .9991 .9991 .9991 .9992 .9992 .9992 9992 .9993 .9993 3.2 .9993 .9993 .9994 .9994 .9994 .9994 .9994 .9995 .9995 .9995 3.3 .9995 .9995 .9995 .9996 .9996 .9996 .9996 .9996 .9996 .9997 3.4 9997 .9997 .9997 .9997 .9997 .9997 .9997 .9997 .9997 .9998 3.50 .9999 and up
Expert Answer:

Related Book For 

Posted Date:
Students also viewed these mathematics questions
-
Between - 1.00 and - 0.50 Assume that thermometer readings are normally distributed with a mean of 0C and a standard deviation of 1.00C. A thermometer is randomly selected and tested. In each case,...
-
Between - 3.00 and Assume that thermometer readings are normally distributed with a mean of 0C and a standard deviation of 1.00C. A thermometer is randomly selected and tested. In each case, draw a...
-
37) Because of inability to pay its debts, the Lou Gi Manufacturing Company has been forced into bankruptcy as of April 1, 20x7. The balance sheet on the date shows: Assets Cash Accounts Receivable...
-
Moe Sahota is the controller of Forochar Ltd., whose year end is December 31. Sahota prepares cheques for suppliers in December and posts them to the appropriate accounts in that month. However, he...
-
If r(30) = .40, p < .05, (a) What conclusion can be drawn about the existence of a relationship between X and Y in the population? (b) Comment on the direction of the relationship in the population.
-
Estimate the overall odds ratio of the set of tables in Problem3.6 and test whether the odds ratios are the same across the tables. Problem3.6 is: 3.6 Use the DOS data to test whether there is gender...
-
Not-for-Profit Hospital Financial Statement Analysis. Examine the financial statements for Oak Valley Hospital for the years ended December 31, 2010, and 2011. Required Prepare a short answer to...
-
The local theater company is choosing its next play. The company's members recently held a vote to decide which of three choices - Elektra, Tartuffe, and Hamlet - the company will perform. The...
-
1. What is Hooke's law? Give one example from real world where you can find its application. 2. How much force is needed to pull a spring with a spring constant of 50 N/m a distance of 10 cm? 3. A...
-
Project Management Fundamentals An Introduction to Project Management, Sixth Edition, Schwalbe, K . ( 2 0 1 7 ) . Using the materials and methods discussed in Chapter 2 and 3, prepare a business case...
-
there is a 4.8 percent coupon bond with six years to maturity and a current price of $1,048.30. What is the dollar value of an 01 for the bond? (Do not round intermediate calculations. Round your...
-
In an attempt to have funds for a down payment in three years, James Dupont plans to save $4,250 a year for the next three years. With an interest rate of 5 percent, what amount will James have...
-
Could you talk to Andrew aswell about frustrations. How would would you re-direct his behaviour to another activity. 3. Andrew has just started at the centre. He is a very happy two-year-old boy,...
-
(XI)Suppose you plan to retire at age 70, and you want to be able to withdraw an amount of $7,000 per month beginning with the first month after your 70th birthday until you reach your birthday at...
-
6.A 5.0 kg wooden block is sitting on a plane of dry snow. What is the force required to start sliding the block if the coefficient of static friction between wood and snow is 0.22 and the...
-
Catherine (aged 42) and Johnson (aged 45) have been married for 12 years. Johnson is a project manager of an event company at a monthly salary of $55,000 with an additional one-month salary of...
-
If four of the test subjects are randomly selected without replacement, find the probability that they all had incorrect test results (either false positive or false negative). Is such an event...
-
Suppose that the results in the table were obtained by mailing a survey to 10,000 executives and recording the 1733 responses that were returned. What is this type of sampling called? Is this type of...
-
The following table lists (in thousands) the numbers of male and female higher education students for different years. (Projections are from the U.S. National Center for Education Statistics.)...
-
Write a MATLAB program to compute the CA-CFAR threshold value. Use a similar approach to that used in the case of a fixed threshold.
-
Starting with Eq. (13.81), show that as \(\mathrm{N}\) is increased so is the over all probability of false alarm. More specifically, prove that \(P_{F A} \approx N P_{f a}\). Equation (13.81) PFA...
-
Design a cylindrical RCS calibration target such that its broadside RCS (cylinder) and end (flat plate) RCS are equal to 10 m2 at f = 9.5 GHz. The RCS for a flat plate of area A is fp = 4f2A2/c2.

Study smarter with the SolutionInn App