

Question: Assume that, using the regression analysis tool in Excel to estimate the demand curve for daily ski lift tickets at a particular mountain resort, you
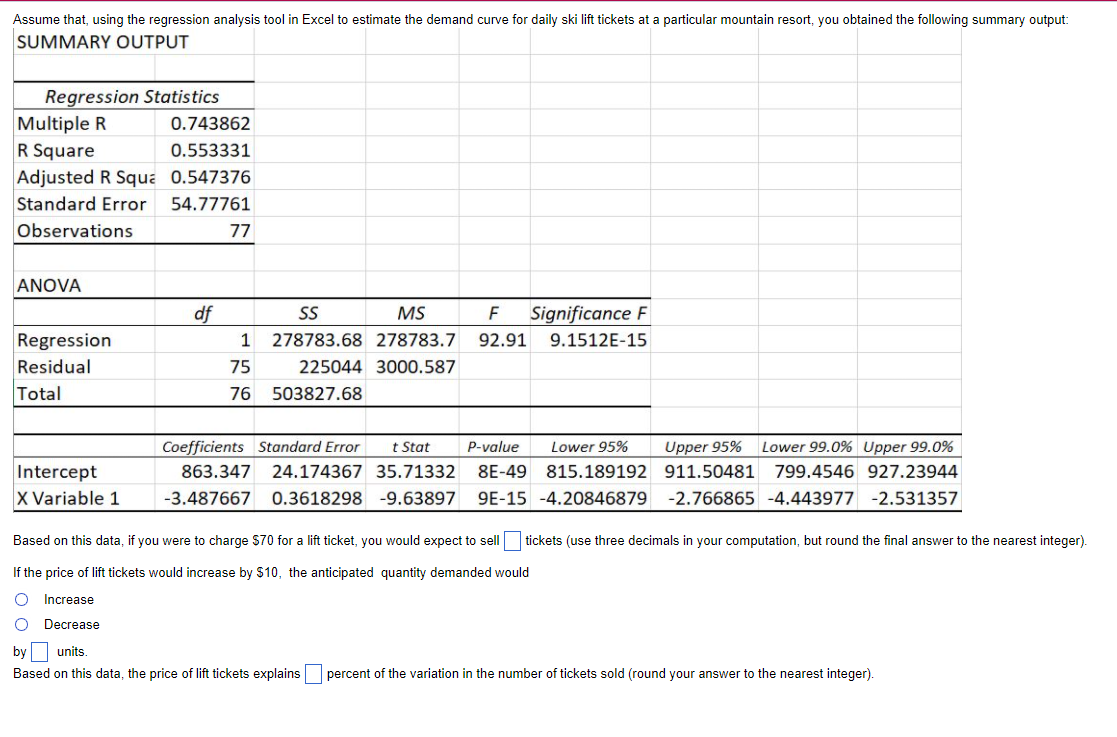
Assume that, using the regression analysis tool in Excel to estimate the demand curve for daily ski lift tickets at a particular mountain resort, you obtained the following summary output: SUMMARY OUTPUT Regression Statistics Multiple R 0.743862 R Square 0.553331 Adjusted R Sque 0.547376 Standard Error 54.77761 Observations 77 ANOVA df SS MS F Significance F Regression 1 278783.68 278783.7 92.91 9.1512E-15 Residual 75 225044 3000.587 Total 76 503827.68 Coefficients Standard Error t Stat P-value Lower 95% Upper 95% Lower 99.0% Upper 99.0% Intercept 863.347 24.174367 35.71332 8E-49 815.189192 911.50481 799.4546 927.23944 X Variable 1 -3.487667 0.3618298 -9.63897 9E-15 -4.20846879 -2.766865 -4.443977 -2.531357 Based on this data, if you were to charge $70 for a lift ticket, you would expect to sell tickets (use three decimals in your computation, but round the final answer to the nearest integer). If the price of lift tickets would increase by $10, the anticipated quantity demanded would O Increase O Decrease by units . Based on this data, the price of lift tickets explains percent of the variation in the number of tickets sold (round your answer to the nearest integer)
Step by Step Solution
There are 3 Steps involved in it

Get step-by-step solutions from verified subject matter experts