

Question: Assume that you have calculated sensitivity and specificity values from multiple confusion matrices for five different parameter sets in your algorithm. Draw the ROC curve
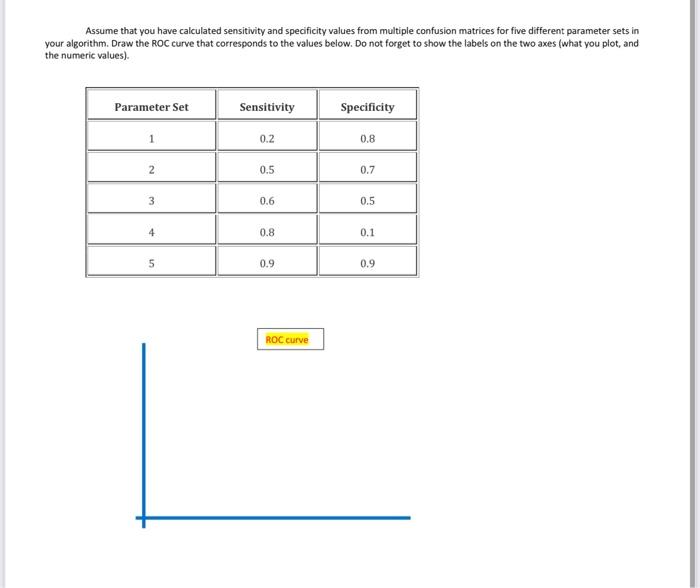
Assume that you have calculated sensitivity and specificity values from multiple confusion matrices for five different parameter sets in your algorithm. Draw the ROC curve that corresponds to the values below. Do not forget to show the labels on the two axes (what you plot, and the numeric values)
Step by Step Solution
There are 3 Steps involved in it
1 Expert Approved Answer
Step: 1 Unlock

Question Has Been Solved by an Expert!
Get step-by-step solutions from verified subject matter experts
Step: 2 Unlock
Step: 3 Unlock