

Question: assume there are no outliers. Draw the boxplot for the following frequency table. You may X f rf cf crf 3 7 0.1228 7
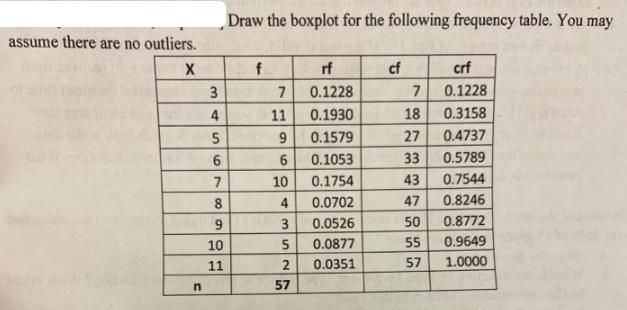
assume there are no outliers. Draw the boxplot for the following frequency table. You may X f rf cf crf 3 7 0.1228 7 0.1228 4 11 0.1930 18 0.3158 5 9 0.1579 27 0.4737 618 6 0.1053 33 0.5789 10 0.1754 43 0.7544 4 0.0702 47 0.8246 9 3 0.0526 50 0.8772 10 5 0.0877 55 0.9649 11 2 0.0351 57 1.0000 n 57
Step by Step Solution
There are 3 Steps involved in it
1 Expert Approved Answer
Step: 1 Unlock

Question Has Been Solved by an Expert!
Get step-by-step solutions from verified subject matter experts
Step: 2 Unlock
Step: 3 Unlock