

Question: Assume you recently used multiple linear regression to explain the variability in the wage rates of Telfer staff in terms of four independent variables: X1,
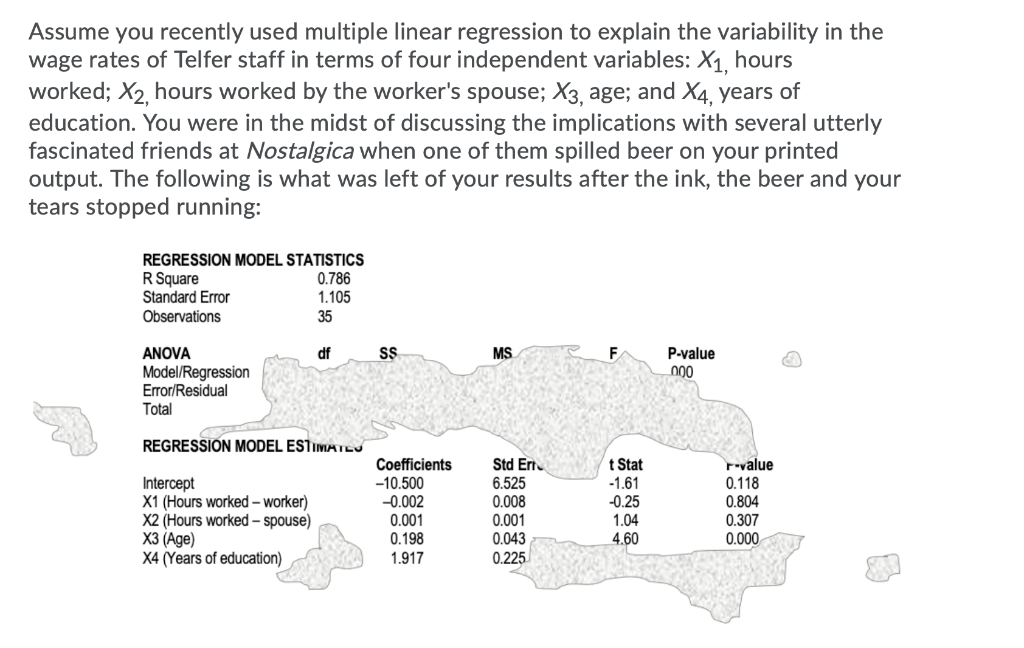
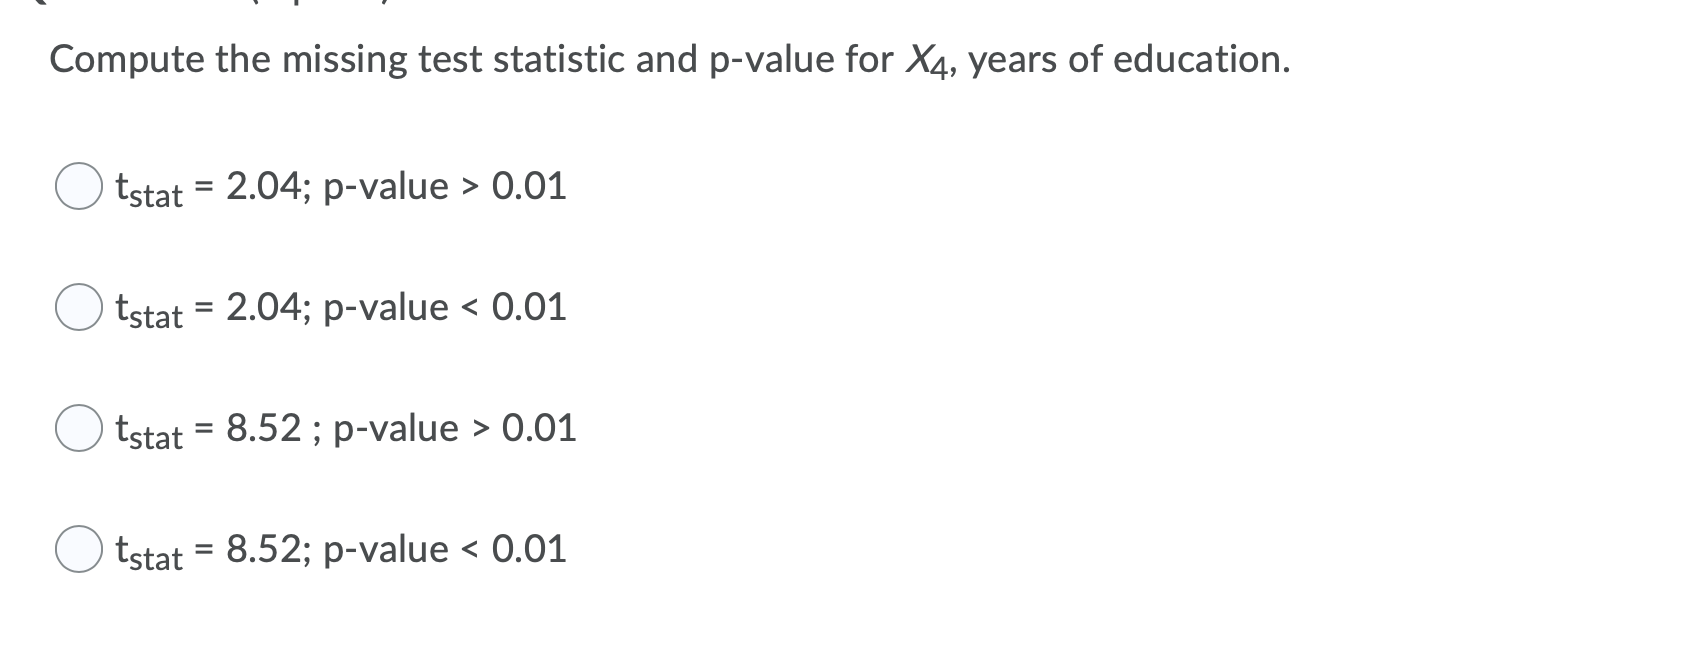
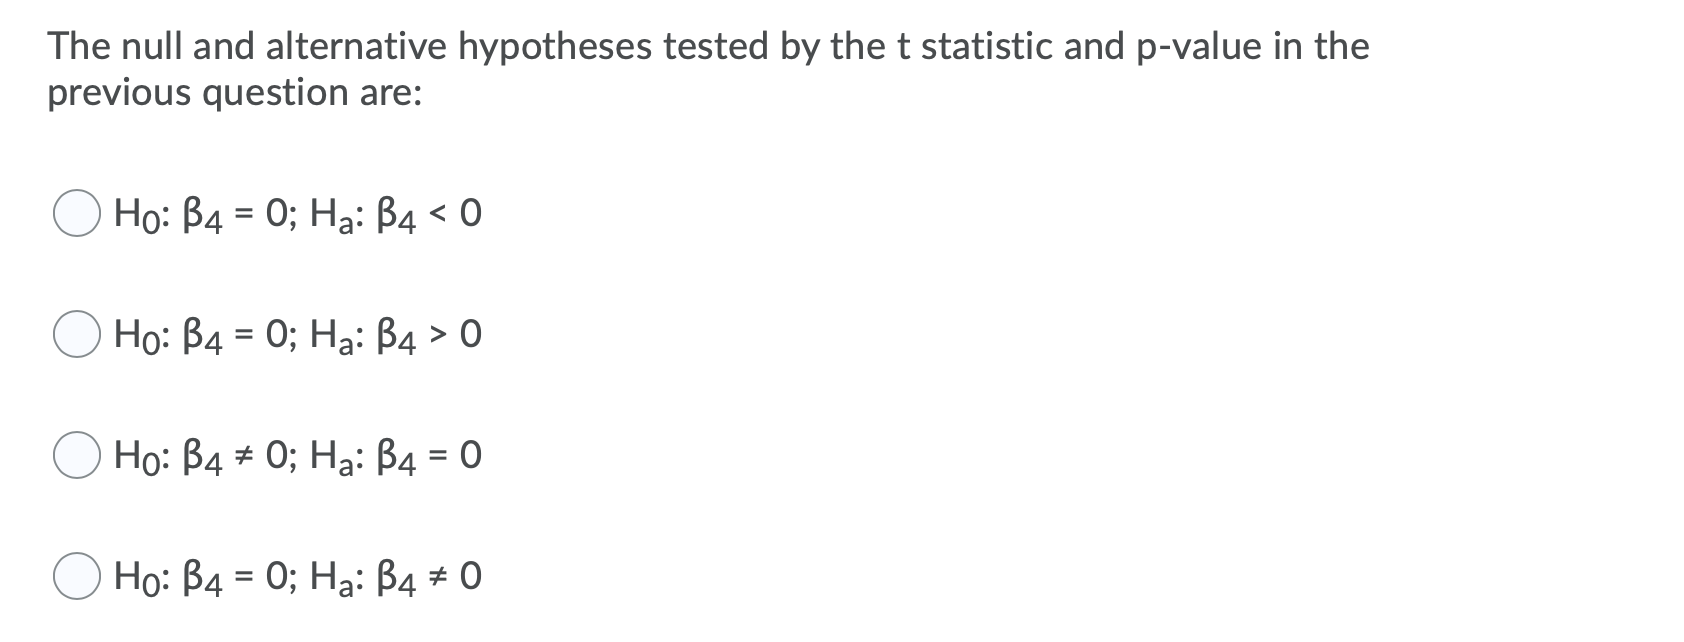
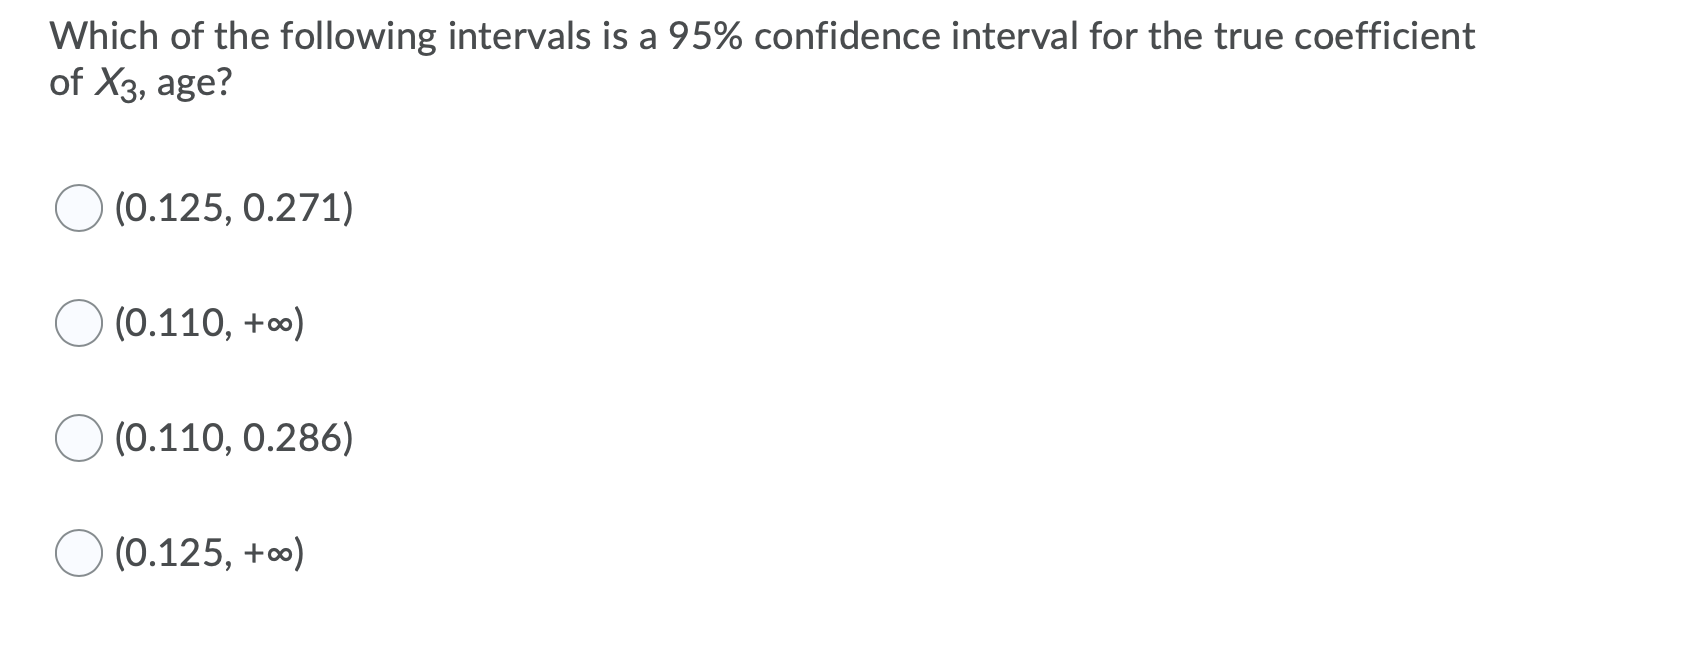
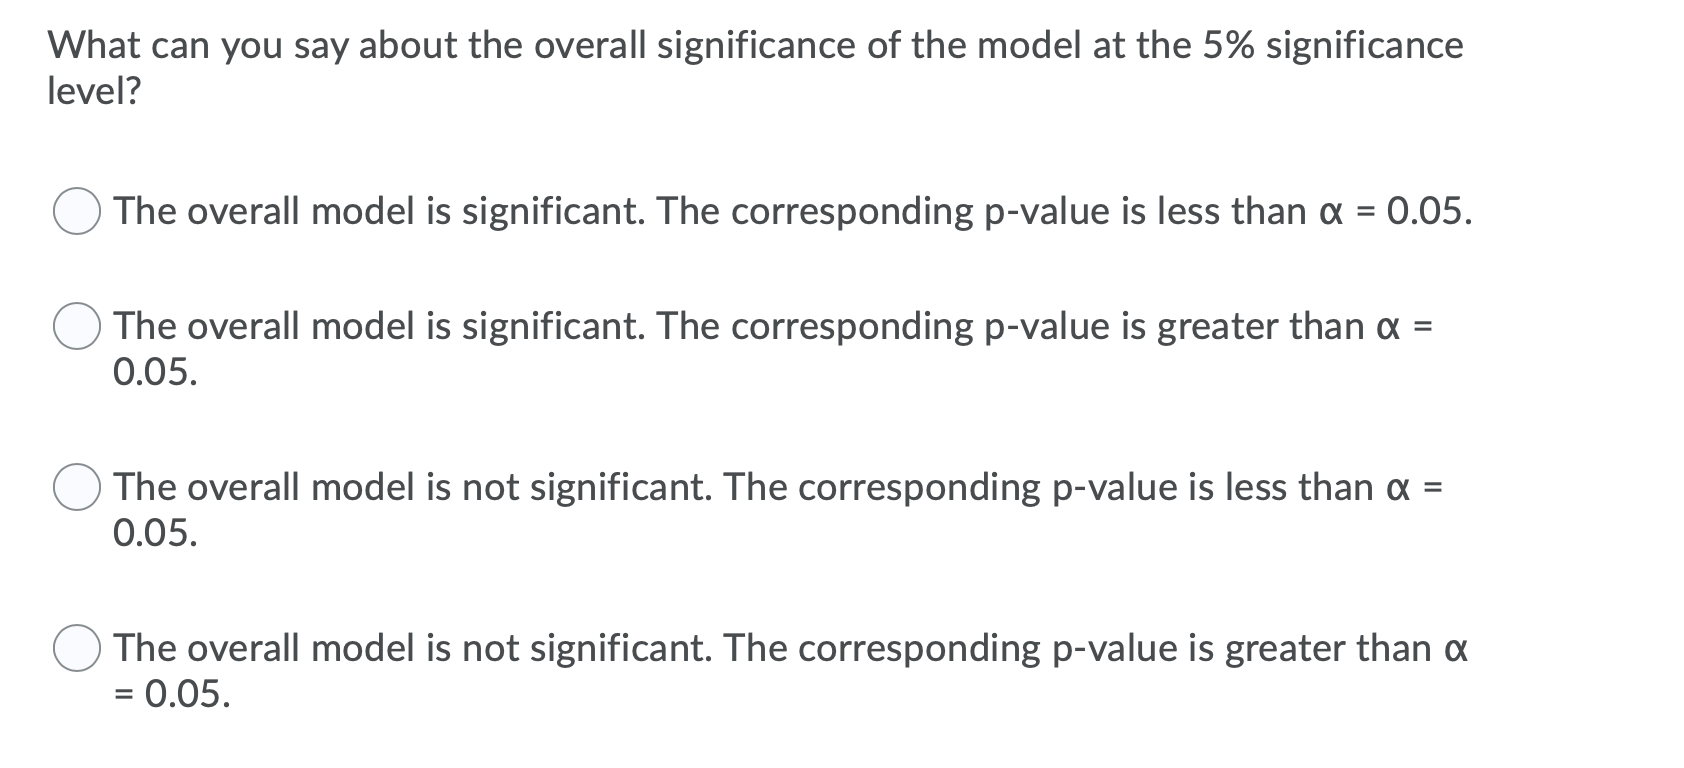
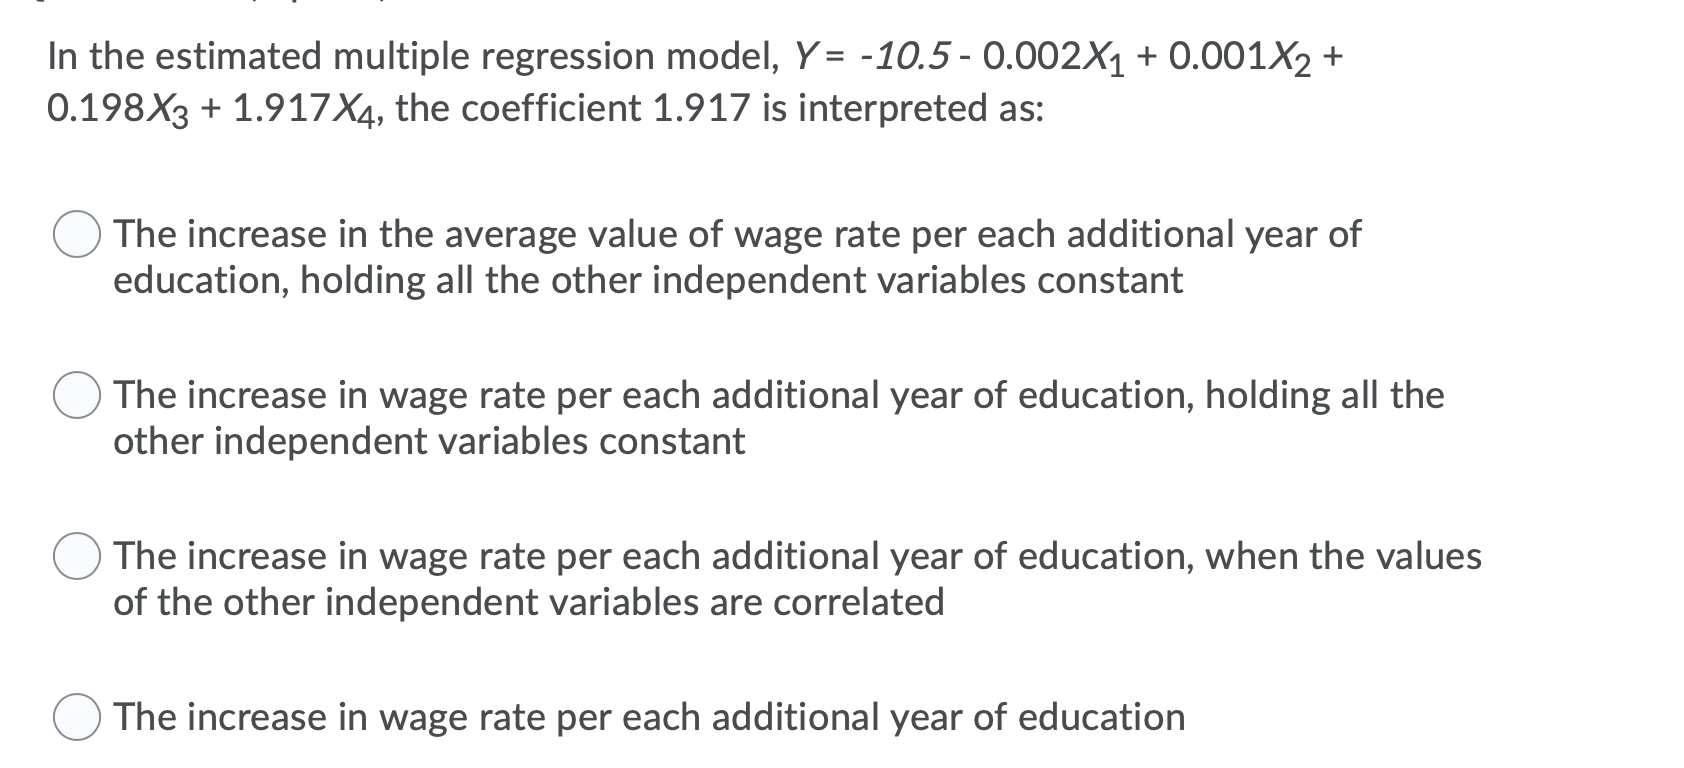
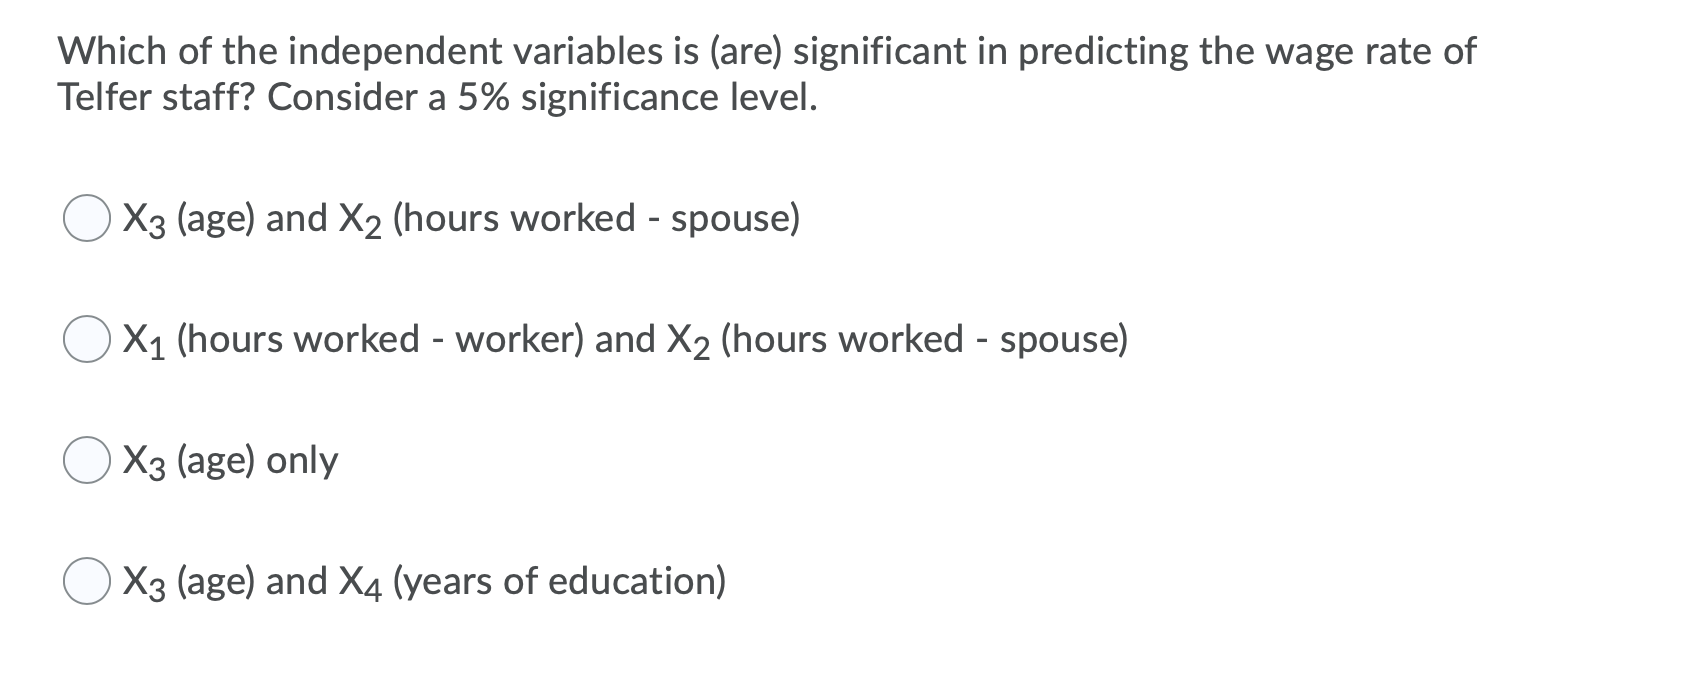
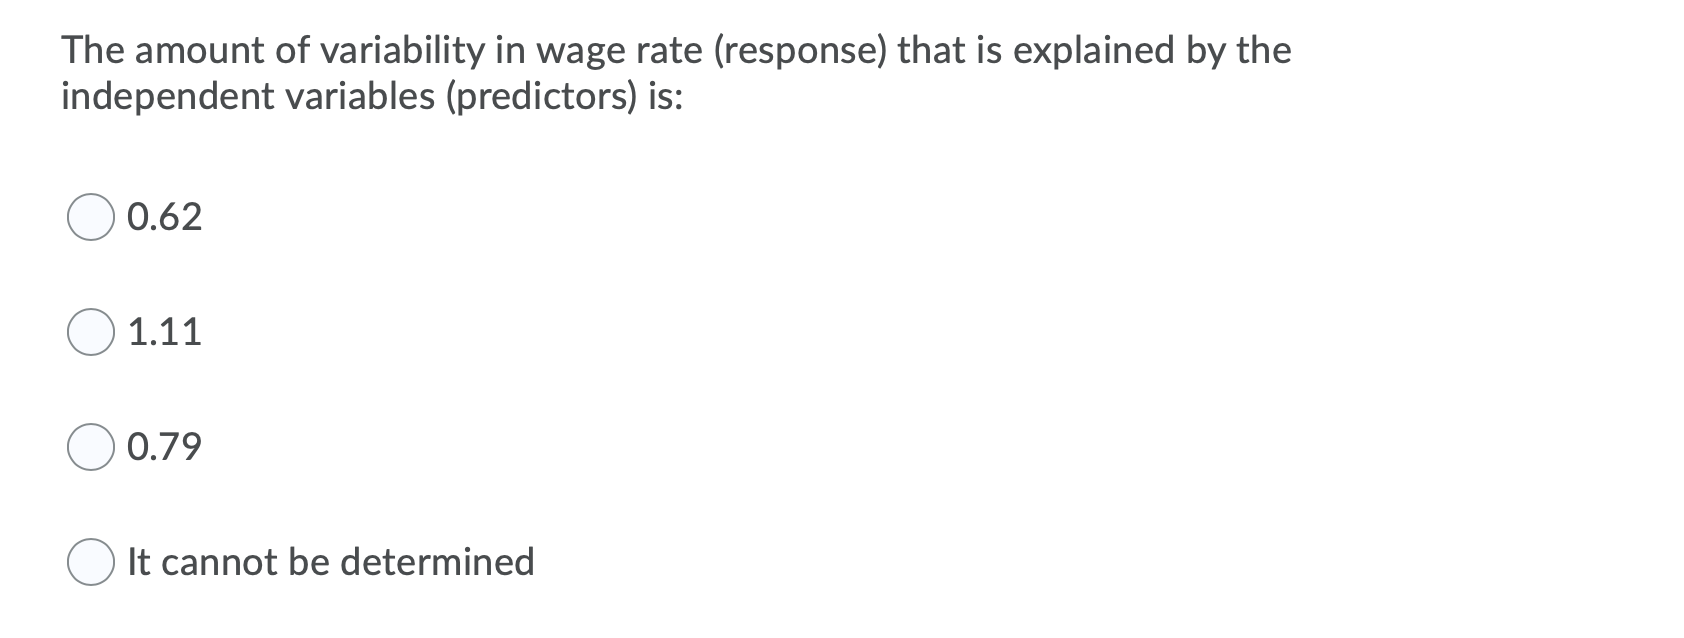
Assume you recently used multiple linear regression to explain the variability in the wage rates of Telfer staff in terms of four independent variables: X1, hours worked; X2, hours worked by the worker's spouse; X3, age; and X4, years of education. You were in the midst of discussing the implications with several utterly fascinated friends at Nostalgica when one of them spilled beer on your printed output. The following is what was left of your results after the ink, the beer and your tears stopped running: REGRESSION MODEL STATISTICS R Square 0.786 Standard Error 1.105 Observations 35 . df SS MS ANOVA Model/Regression Error/Residual Total P-value 000 REGRESSION MODEL ESTUIVATLU Intercept X1 (Hours worked - worker) X2 (Hours worked - spouse) X3 (Age) X4 (Years of education) Coefficients -10.500 -0.002 0.001 0.198 1.917 Std Er 6.525 0.008 0.001 0.043 0.225 t Stat -1.61 -0.25 1.04 4.60 -value 0.118 0.804 0.307 0.000 Compute the missing test statistic and p-value for X4, years of education. tstat = 2.04; p-value > 0.01 tstat = 2.04; p-value 0.01 = tstat = 8.52; p-value 0 Ho: B4 = 0; Ha: B4 = 0 Ho: B4 = 0; Ha: B4 0 Which of the following intervals is a 95% confidence interval for the true coefficient of X3, age? (0.125, 0.271) (0.110, +00) (0.110, 0.286) (0.125, +00) What can you say about the overall significance of the model at the 5% significance level? The overall model is significant. The corresponding p-value is less than a = 0.05. = The overall model is significant. The corresponding p-value is greater than a = 0.05. = The overall model is not significant. The corresponding p-value is less than a = 0.05. The overall model is not significant. The corresponding p-value is greater than a = 0.05. In the estimated multiple regression model, Y = -10.5 -0.002X1 + 0.001X2 + 0.198X3 + 1.917X4, the coefficient 1.917 is interpreted as: The increase in the average value of wage rate per each additional year of education, holding all the other independent variables constant The increase in wage rate per each additional year of education, holding all the other independent variables constant The increase in wage rate per each additional year of education, when the values of the other independent variables are correlated The increase in wage rate per each additional year of education Which of the independent variables is (are) significant in predicting the wage rate of Telfer staff? Consider a 5% significance level. X3 (age) and X2 (hours worked - spouse) OX1 (hours worked - worker) and X2 (hours worked - spouse) X3 (age) only X3 (age) and X4 (years of education) The amount of variability in wage rate (response) that is explained by the independent variables (predictors) is: 0.62 01.11 0.79 It cannot be determined
Step by Step Solution
There are 3 Steps involved in it

Get step-by-step solutions from verified subject matter experts