

Question: Assuming a normal distribution, make a frequency analysis of the July evaporation ( E ) on Wildcat Creek for the period 1 9 5 4
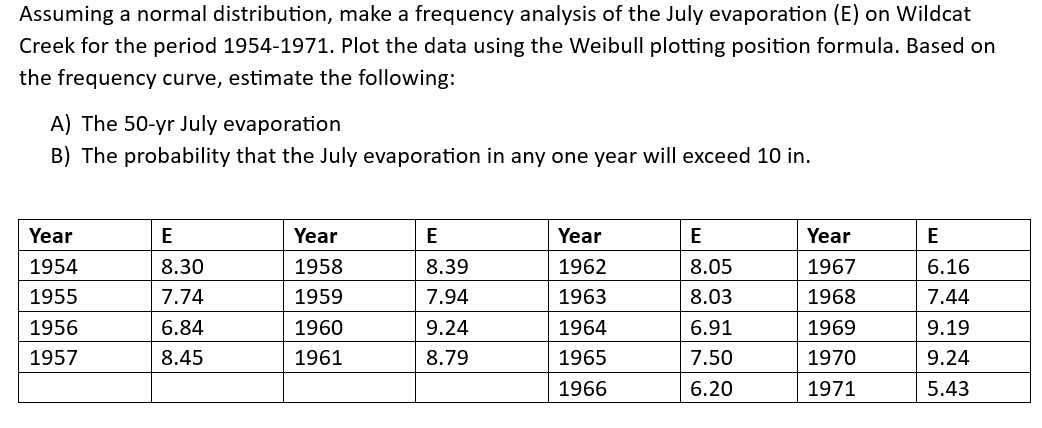
Assuming a normal distribution, make a frequency analysis of the July evaporation E on Wildcat
Creek for the period Plot the data using the Weibull plotting position formula. Based on
the frequency curve, estimate the following:
A The yr July evaporation
B The probability that the July evaporation in any one year will exceed in
Step by Step Solution
There are 3 Steps involved in it
1 Expert Approved Answer
Step: 1 Unlock

Question Has Been Solved by an Expert!
Get step-by-step solutions from verified subject matter experts
Step: 2 Unlock
Step: 3 Unlock