

Question: * Assuming Dells sales will grow at 50% in 1997, how would you recommend that the Company funds this growth? How much capital would need
* Assuming Dells sales will grow at 50% in 1997, how would you recommend that the Company funds this growth? How much capital would need to be reduced and/or profit margin increased if the company were to fund its growth by relying only on internal sources of capital? What steps would you recommend the company take?
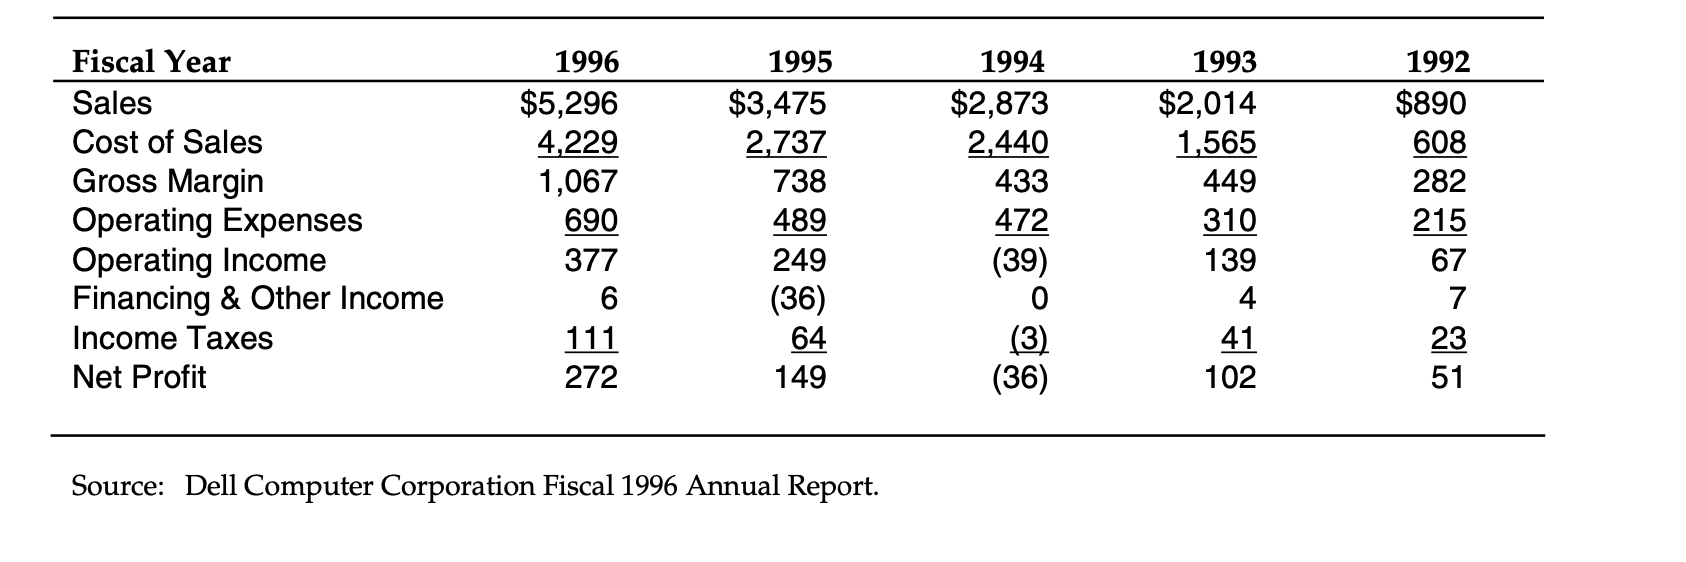
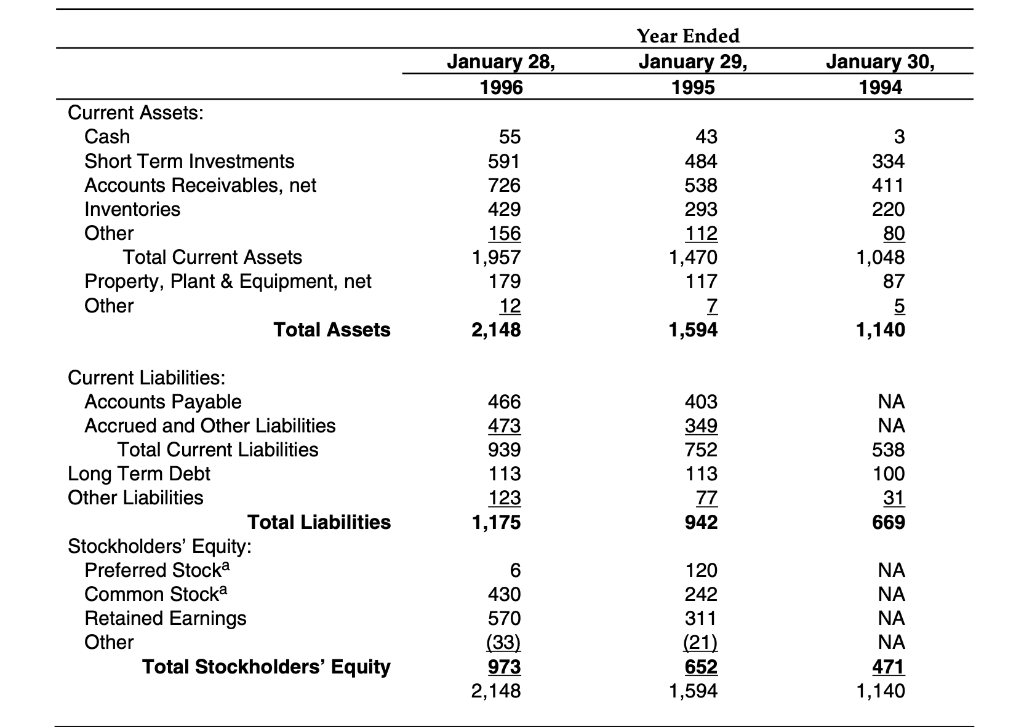
The Future For its 1996 fiscal year, ended January 31, 1996, Dell reported revenue of $5.3 billion with net income of $272 million, or 5.1% of sales. Revenue was up 52% over the prior year compared with an industry increase of 31%. Exhibits 4 and 5 presents Dell's Income Statement and Balance Sheet, respectively. Though favorable, the 1996 results suffered somewhat from component shortages. Michael Dell predicted the company's growth rate for the next year would again outpace the industry's growth. Fiscal Year Sales Cost of Sales Gross Margin Operating Expenses Operating Income Financing & Other Income Income Taxes Net Profit 1996 $5,296 4,229 1,067 690 377 6 111 272 1995 $3,475 2,737 738 489 249 (36) 64 149 1994 $2,873 2,440 433 472 (39) 0 (3) (36) 1993 $2,014 1,565 449 310 139 4 41 102 1992 $890 608 282 215 67 7 23 51 Source: Dell Computer Corporation Fiscal 1996 Annual Report. January 28, 1996 Year Ended January 29, 1995 January 30, 1994 55 591 Current Assets: Cash Short Term Investments Accounts Receivables, net Inventories Other Total Current Assets Property, Plant & Equipment, net Other Total Assets 726 429 156 1,957 179 12 2,148 43 484 538 293 112 1,470 117 7 1,594 3 334 411 220 80 1,048 87 5 1,140 Current Liabilities: Accounts Payable Accrued and Other Liabilities Total Current Liabilities Long Term Debt Other Liabilities Total Liabilities Stockholders' Equity: Preferred Stocka Common Stocka Retained Earnings Other Total Stockholders' Equity 466 473 939 113 123 1,175 403 349 752 113 77 942 NA NA 538 100 31 669 6 430 570 (33) 973 2,148 120 242 311 (21) 652 1,594 NA NA NA NA 471 1,140 The Future For its 1996 fiscal year, ended January 31, 1996, Dell reported revenue of $5.3 billion with net income of $272 million, or 5.1% of sales. Revenue was up 52% over the prior year compared with an industry increase of 31%. Exhibits 4 and 5 presents Dell's Income Statement and Balance Sheet, respectively. Though favorable, the 1996 results suffered somewhat from component shortages. Michael Dell predicted the company's growth rate for the next year would again outpace the industry's growth. Fiscal Year Sales Cost of Sales Gross Margin Operating Expenses Operating Income Financing & Other Income Income Taxes Net Profit 1996 $5,296 4,229 1,067 690 377 6 111 272 1995 $3,475 2,737 738 489 249 (36) 64 149 1994 $2,873 2,440 433 472 (39) 0 (3) (36) 1993 $2,014 1,565 449 310 139 4 41 102 1992 $890 608 282 215 67 7 23 51 Source: Dell Computer Corporation Fiscal 1996 Annual Report. January 28, 1996 Year Ended January 29, 1995 January 30, 1994 55 591 Current Assets: Cash Short Term Investments Accounts Receivables, net Inventories Other Total Current Assets Property, Plant & Equipment, net Other Total Assets 726 429 156 1,957 179 12 2,148 43 484 538 293 112 1,470 117 7 1,594 3 334 411 220 80 1,048 87 5 1,140 Current Liabilities: Accounts Payable Accrued and Other Liabilities Total Current Liabilities Long Term Debt Other Liabilities Total Liabilities Stockholders' Equity: Preferred Stocka Common Stocka Retained Earnings Other Total Stockholders' Equity 466 473 939 113 123 1,175 403 349 752 113 77 942 NA NA 538 100 31 669 6 430 570 (33) 973 2,148 120 242 311 (21) 652 1,594 NA NA NA NA 471 1,140
Step by Step Solution
There are 3 Steps involved in it

Get step-by-step solutions from verified subject matter experts