

Question: Assuming that A&A, CPAs has accepted the re-audit work for B Company, you are going to review and apply the audit process planning and risk
Assuming that A&A, CPAs has accepted the re-audit work for B Company, you are going to review and apply the audit process planning and risk assessment procedures. Through reviewing these documents, you will see audit workpapers and have the opportunity to assess the auditors performance of the required procedures. In addition, you will be able to consider B Companys overall financial statement risk and the account level risks as you review the workpapers. The audit workpapers also include audit documentation on the auditors materiality calculations and overall risk assessment of inherent risk, control risk, and detection risk. Through this project, you will apply the auditors consideration of client risk and how this assessment affects the audit tasks within the professional ethics framework.
Before beginning the assignment, take a moment to look through the workpapers in this project. Note in the lower left-hand corner that some documents are audit work papers created by A&A as they conducted the audit. Note that other papers are client documents that A&A collected and kept in support of their audit. Finally, note the numbering system in the lower right-hand corner of each page and how each paper within the audit is numbered and linked back to the audit program.
You will examine the firms audit documentation in relation to the auditors performance on several risk assessment procedures. Please complete the following tasks:
- Evaluate A&As documentation of the clients environment. Describe any problems you find and provide suggestions for improvement.
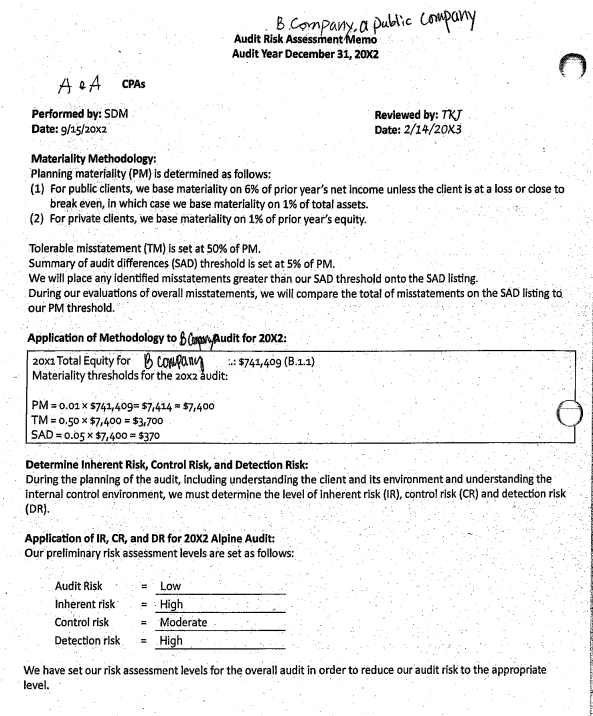
- Review A&As calculations of materiality thresholds for the 20x2 Audit. Determine if the auditors correctly applied the materiality concept in their risk assessment procedures. Describe any problems you find and provide suggestions for improvement.
- Evaluate the preliminary analytical procedures completed by A&A.
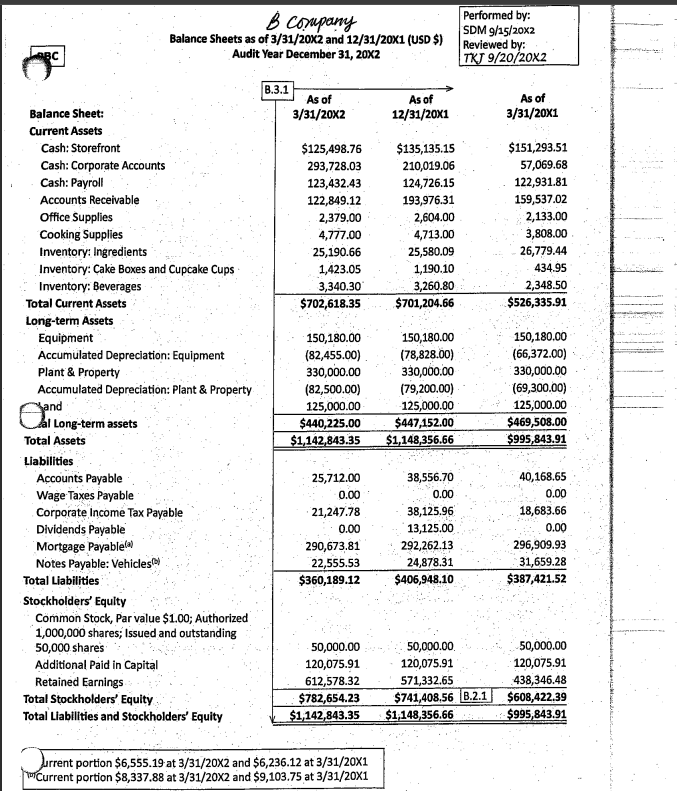
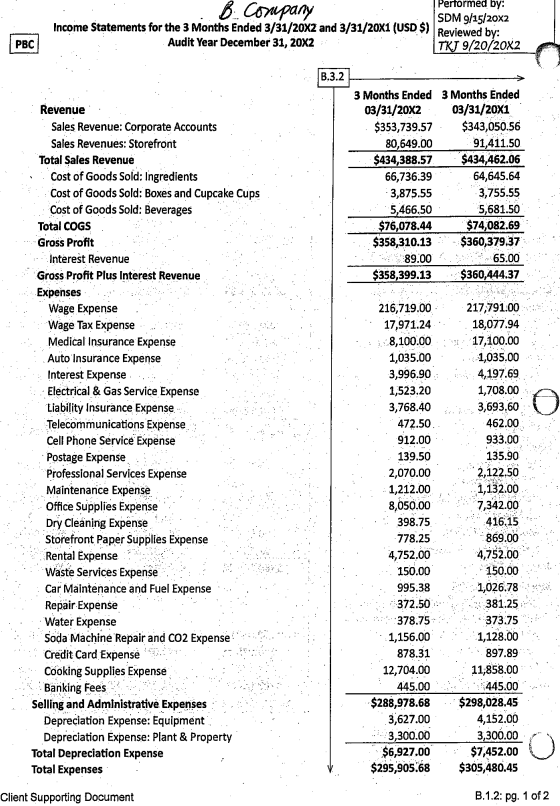
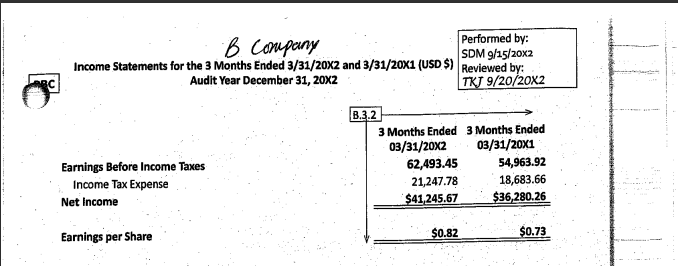
- Determine if the analyses of account fluctuations were appropriately performed and completed (workpapers B.3.1 and B.3.2). Review the explanations of account fluctuations provided by the auditors. Describe any problems you identify.
- Determine if the ratio analysis (workpaper B.3.3) was appropriately performed and completed (workpapers B.3.1 and B.3.2). Review the explanations of account fluctuations provided by the auditors. Describe any problems you identify.
- Assuming that you have found some problems after reviewing the workpapers conducted by the auditors and requesting additional work would have the risk of significantly running over the original time budget approved by the audit engagement manager based on the engagement letter. Spending more time on the audit engagement would potentially reduce the profitability of the audit firm, which will displease the audit manager and the engagement partner. Using the professional ethics framework, decide what you would do. Explain your rationale. How can you do what you think is the right thing without undermining your managers confidence in your ability to get a job done?
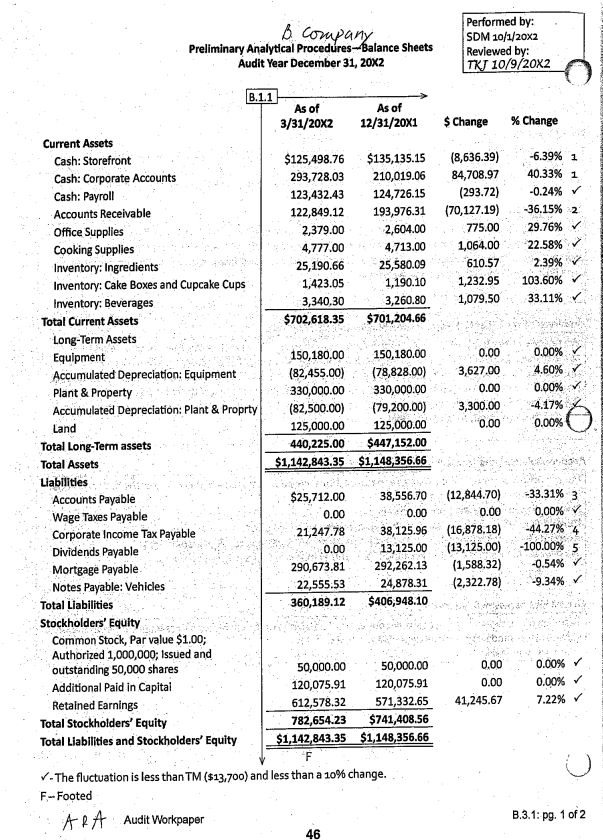
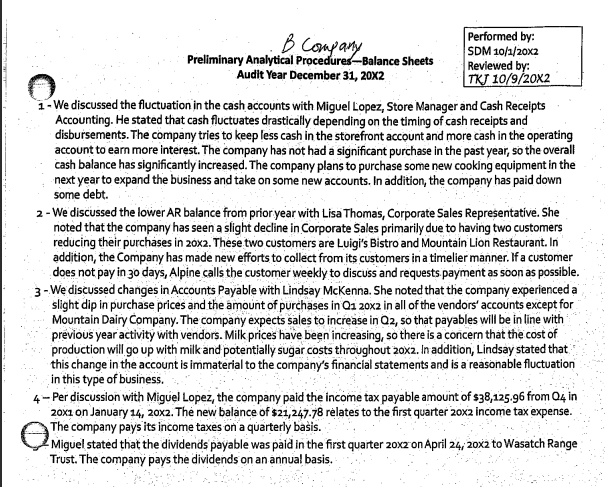
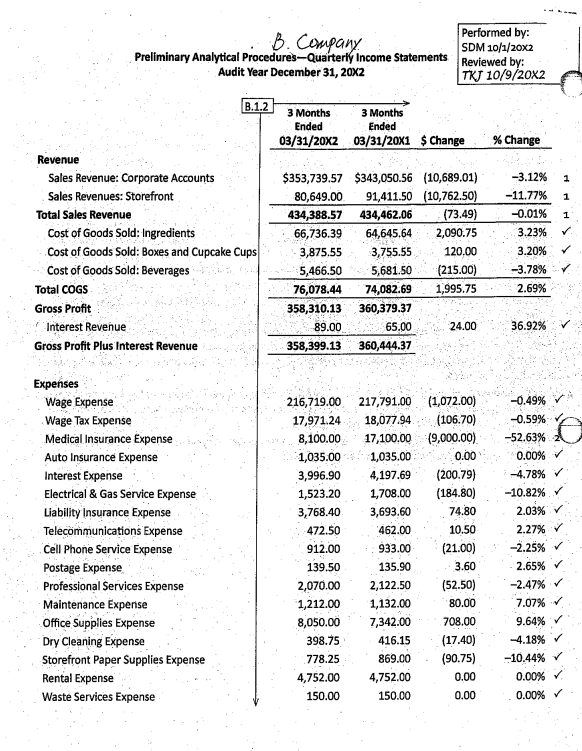
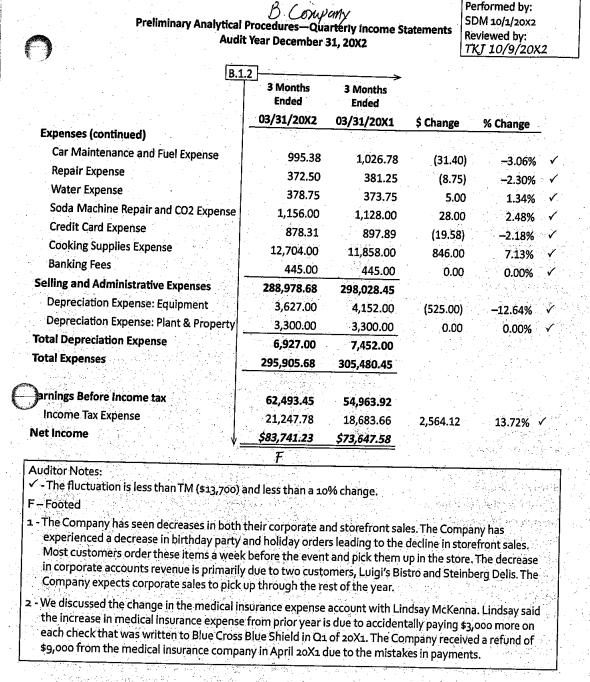
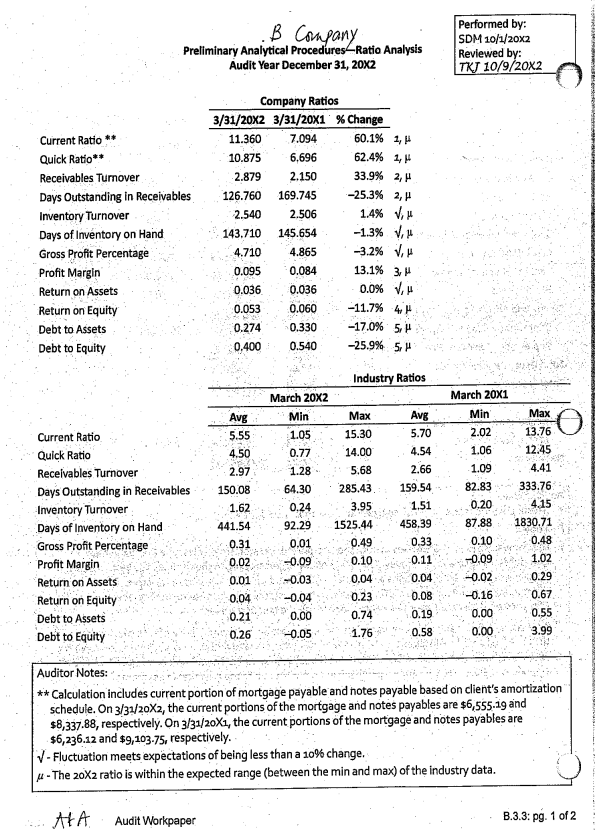
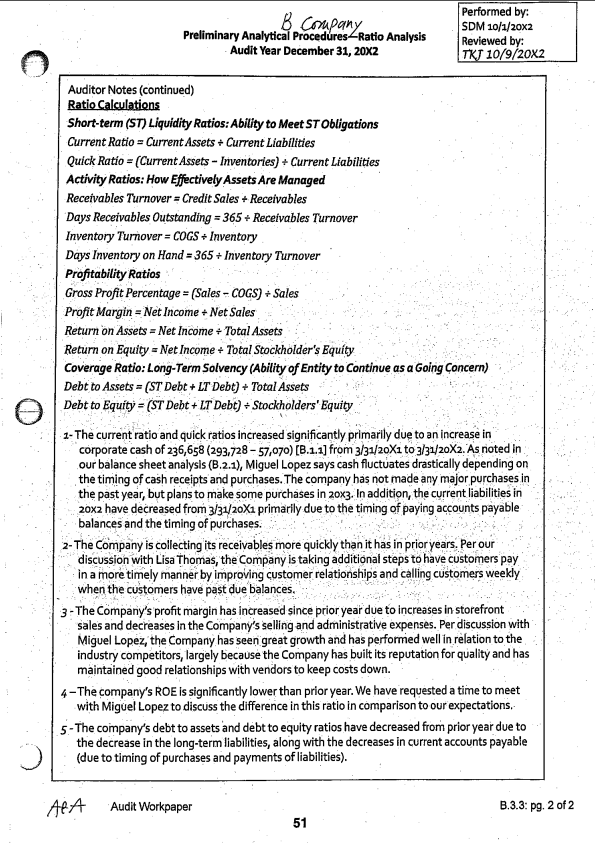
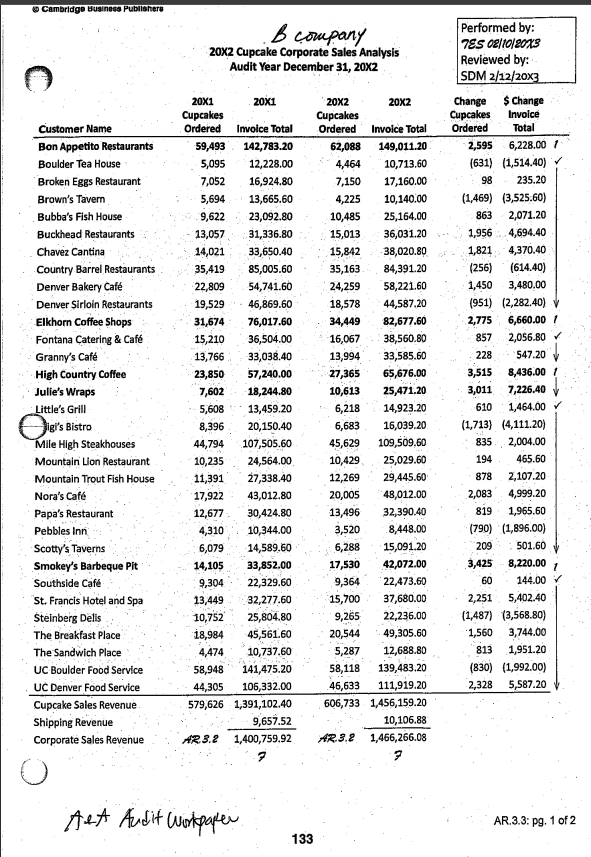
B company Balance Sheets as of 3/31/20x2 and 12/31/20X1 (USD $) Audit Year December 31, 20X2 Performed by: SDM 9/15/20X2 Reviewed by: TKJ 9/20/20X2 ABC B.3.1 As of 3/31/20X2 As of 12/31/20X1 As of 3/31/20X1 $125,498.76 293,728.03 123,432.43 122,849.12 2,379.00 4,777.00 25,190.66 1,423.05 3,340.30 $702,618.35 $135,135.15 210,019.06 124,726.15 193,976.31 2,604.00 4,713.00 25,580.09 1,190.10 3,260.80 $701,204.66 $151,293.51 57,069.68 122,931.81 159,537.02 2,133.00 3,808.00 26,779.44 434.95 2,348.50 $526,335.91 Balance Sheet: Current Assets Cash: Storefront Cash: Corporate Accounts Cash: Payroll Accounts Receivable Office Supplies Cooking Supplies Inventory: Ingredients Inventory: Cake Boxes and Cupcake Cups Inventory: Beverages Total Current Assets Long-term Assets Equipment Accumulated Depreciation: Equipment Plant & Property Accumulated Depreciation: Plant & Property and al Long-term assets Total Assets Liabilities Accounts Payable Wage Taxes Payable Corporate Income Tax Payable Dividends Payable Mortgage Payablela Notes Payable: Vehicles Total Liabilities Stockholders' Equity Common Stock, Par value $1.00; Authorized 1,000,000 shares; Issued and outstanding 50,000 shares Additional Paid in Capital Retained Earnings Total Stockholders' Equity Total Liabilities and Stockholders' Equity 150,180.00 (82,455.00) 330,000.00 (82,500.00) 125,000.00 $440,225.00 $1,142,843.35 150,180.00 (78,828.00) 330,000.00 (79,200.00) 125,000.00 $447,152.00 $1,148,356.66 150,180.00 (66,372.00) 330,000.00 (69,300.00) 125,000.00 $469,508.00 $995,843.91 25,712.00 0.00 21,247.78 0.00 290,673.81 22,555.53 $360,189.12 38,556.70 0.00 38,125.96 13,125.00 292,262.13 24,878.31 $406,948.10 40,168.65 0.00 18,683.66 0.00 296,909.93 31,659.28 $387,421.52 50,000.00 120,075.91 612,578.32 $782,654.23 $1,142,843.35 50,000.00 120,075.91 571,332.65 $741,408.56 3.2.1 $1 148,356.66 50,000.00 120,075.91 438,346.48 $608,422.39 $995,843.91 urrent portion $6,555.19 at 3/31/20X2 and $6,236.12 at 3/31/20x1 Current portion $8,337.88 at 3/31/20X2 and $9,103.75 at 3/31/20X1 Performed by: B. Company SDM 9/15/20X2 Income Statements for the 3 Months Ended 3/31/20x2 and 3/31/20X1 (USD $) Reviewed by: Audit Year December 31, 20X2 TKJ 9/20/20x2 PBC B.3.2 3 Months Ended 3 Months Ended 03/31/20X2 03/31/20X1 $353,739.57 $343,050.56 80,649.00 91,411.50 $434,388.57 $434,462.06 66,736.39 64,645.64 3,875.55 3,755.55 5,466.50 5,681.50 $76,078.44 $74,082.69 $358,310.13 $360,379.37 89.00 65.00 $358,399.13 $360,444.37 Revenue Sales Revenue: Corporate Accounts Sales Revenues: Storefront Total Sales Revenue Cost of Goods Sold: Ingredients Cost of Goods Sold: Boxes and Cupcake Cups Cost of Goods Sold: Beverages Total COGS Gross Profit Interest Revenue Gross Profit Plus Interest Revenue Expenses Wage Expense Wage Tax Expense Medical Insurance Expense Auto Insurance Expense Interest Expense Electrical & Gas Service Expense Liability Insurance Expense Telecommunications Expense Cell Phone Service Expense Postage Expense Professional Services Expense Maintenance Expense Office Supplies Expense Dry Cleaning Expense Storefront Paper Supplies Expense Rental Expense Waste Services Expense Car Maintenance and Fuel Expense Repair Expense Water Expense Soda Machine Repair and CO2 Expense Credit Card Expense Cooking Supplies Expense Banking Fees Selling and Administrative Expenses Depreciation Expense: Equipment Depreciation Expense: Plant & Property Total Depreciation Expense Total Expenses Client Supporting Document 216,719.00 17,971.24 8,100.00 1,035.00 3,996.90 1,523.20 3,768.40 472.50 912.00 139.50 2,070.00 1,212.00 8,050.00 398.75 778.25 4,752.00 150.00 995.38 372.50 378.75 1,156.00 878.31 12,704.00 445.00 $288,978.68 3,627.00 3,300.00 $6,927.00 $295,905.68 217,791.00 18,077.94 17,100.00 1,035.00 4,197.69 1,708.00 3,693,60 462.00 933.00 135.90 2,122.50 1,132.00 7,342.00 416.15 869.00 4,752.00 150.00 1,026.78 381.25 373.75 1,128.00 897.89 11,858.00 445.00 $298,028.45 4,152.00 3,300.00 $7,452.00 $305,480.45 B.1.2: pg. 1 of 2 B Company Performed by: SDM 9/15/20x2 Income Statements for the 3 Months Ended 3/31/20X2 and 3/31/20X1 (USD $) Reviewed by: Audit Year December 31, 20X2 TKJ 9/20/20x2 Earnings Before Income Taxes Income Tax Expense Net Income B.3.2 3 Months Ended 3 Months Ended 03/31/20X2 03/31/20X1 62,493.45 54,963.92 21,247.78 18,683.66 $41, 245.67 $36,280.26 $0.82 $0.73 Earnings per Share B.Company, a public company Audit Risk Assessment Memo Audit Year December 31, 20X2 C ARA CPAS Performed by: SDM Date: 9/15/20x2 Reviewed by: TKJ Date: 2/14/20X3 Materiality Methodology: Planning materiality (PM) is determined as follows: (1) For public clients, we base materiality on 6% of prior year's net income unless the client is at a loss or close to break even, in which case we base materiality on 1% of total assets. (2) For private clients, we base materiality on 1% of prior year's equity. Tolerable misstatement (TM) is set at 50% of PM. Summary of audit differences (SAD) threshold is set at 5% of PM. We will place any identified misstatements greater than our SAD threshold onto the SAD listing. During our evaluations of overall misstatements, we will compare the total of misstatements on the SAD listing to our PM threshold. Application of Methodology to B Company Audit for 20X2: 20x1 Total Equity for B company .: $741,409 (B.1.1) Materiality thresholds for the 20x2 audit: PM = 0.01 X 5741,409= $7,414 57,400 TM=0.50 $7,400 = $3,700 SAD=0.65 $7,400 $370 Determine Inherent Risk, Control Risk, and Detection Risk: During the planning of the audit, including understanding the client and its environment and understanding the internal control environment, we must determine the level of inherent risk (IR), control risk (CR) and detection risk (DR). Application of IR, CR, and DR for 20x2 Alpine Audit: Our preliminary risk assessment levels are set as follows: Audit Risk Inherent risk Control risk Detection risk Low High Moderate High = We have set our risk assessment levels for the overall audit in order to reduce our audit risk to the appropriate level. B. Company Audit Risk Assessment Memo Audit Year December 31, 20X2 Performed by: SDM Reviewed by: TKT Date: 9/15/20x2 Date: 2/14/2003 Fraud Brainstorming: To comply with PCAOB ASC 2110, Identifying and Assessing Risks of Material Misstatement, the firm requires all engagement team personnel to be involved in a brainstorming session, during which team members exchange ideas about how and where the client's financial statements may be susceptible to material misstatement due to fraud. Documentation: As required, Tryg Johnson and I conducted a fraud brainstorming session on February 6, 20X3. Overall we find the client to be highly ethical. Owner Alexis Madison has the highest integrity and has strong ties to the community. Tryg and I concluded that there was little or no risk of material misstatement due to fraud at and no accounts for which fraud was a concern. Simon Malik Tryg Johnson Understanding of Client's Environment Including Internal Controls: We reviewed the client's background information retained in our PERM FILE workpapers to understand the company and its inherent risk. We will also perform an understanding of internal controls over the client's processes prior to our test of control procedures (see audit program. Through performing preliminary analytical procedures, we also assessed any significant changes within the company's accounts and activities (see WPS B.3.1 through B.3.3.) Per discussion with Alexis Madison, there are no significant changes within the company yond the consideration of issuing debt. SDM Account Balances and Transaction Risk Assessment: Per our review of the account balances and transactions, we have assessed a higher level for the risk of material misstatement in the following accounts: Inventory (due to inventory price fluctuations) Revenue (potential fictitious sales could lead to overstated revenues) Accounts Receivable (potential fictitious sales transactions could lead to AR overstatement) We believe that there is a higher likelihood for material misstatements in these accounts. SDM Overall Risk Assessment Summary: Based on our preliminary analytical procedures, and knowledge of the client, we assess inherent risk as high and control risk as moderate, making detection risk high. Simon Malik B Company Preliminary Analytical Procedures-Balance Sheets Audit Year December 31, 20X2 Performed by: SDM 10/1/20X2 Reviewed by: TKJ 10/9/20X2 % Change -6.39% 1 40.33% 1 -0.24% 36.15% 2 29.76% 22.58% 2.39% v 103.60% 33.11% 0.00% 4.60% 0.00% -4.17% 0.00% B.1.1 As of As of 3/31/20X2 12/31/20X1 $ Change Current Assets Cash: Storefront $125,498.76 $135,135.15 (8,636.39) Cash: Corporate Accounts 293,728.03 210,019.06 84,708.97 Cash: Payroll 123,432.43 124,726.15 (293.72) Accounts Receivable 122,849.12 193,976.31 (70,127.19) Office Supplies 2,379.00 2,604.00 775.00 Cooking Supplies 4,777.00 4,713.00 1,064.00 Inventory: Ingredients 25,190.66 25,580.09 610.57 Inventory: Cake Boxes and Cupcake Cups 1,423.05 1,190.10 1,232.95 Inventory: Beverages 3,340.30 3,260.80 1,079.50 Total Current Assets $702,618.35 $701,204.66 Long-Term Assets Equipment 150,180.00 150,180.00 0.00 Accumulated Depreciation: Equipment (82,455.00) (78,828.00) 3,627.00 Plant & Property 330,000.00 330,000.00 0.00 Accumulated Depreciation: Plant & Proprty (82,500.00) (79,200.00) 3,300.00 Land 125,000.00 125,000.00 0.00 Total Long-Term assets 440,225.00 $447,152.00 Total Assets $1,142,843.35 $1,148,356.66 Liabilities Accounts Payable $25,712.00 38,556.70 (12,844.70) Wage Taxes Payable 0.00 0.00 0.00 Corporate Income Tax Payable 21,247.78 38,125.96 (16,878,18) Dividends Payable 0.00 13,125.00 (13,125.00) Mortgage Payable 290,673.81 292,262.13 (1,588.32) Notes Payable: Vehicles 22,555.53 24,878.31 (2,322.78) Total Liabilities 360,189.12 $406,948.10 Stockholders' Equity Common Stock, Par value $1.00; Authorized 1,000,000; Issued and outstanding 50,000 shares 50,000.00 50,000.00 0.00 Additional Paid in Capital 120,075.91 120,075.91 0.00 Retained Earnings 612,578.32 571,332.65 41,245.67 Total Stockholders' Equity 782,654.23 $741,408.56 Total Liabilities and Stockholders' Equity $1,142,843.35 $1,148,356.66 F -The fluctuation is less than TM ($13,700) and less than a 10% change. F-Footed APA Audit Workpaper 46 -33.31% 3 0,00% -44.27% -4 -100.00% 5 -0.54% -9.34% 0.00% 0.00% 7.22% B.3.1: pg. 1 of 2 B Company Performed by: SDM 10/1/20X2 Preliminary Analytical Procedures-Balance Sheets Reviewed by: Audit Year December 31, 20X2 TKJ 10/9/20X2 1 - We discussed the fluctuation in the cash accounts with Miguel Lopez, Store Manager and Cash Receipts Accounting. He stated that cash fluctuates drastically depending on the timing of cash receipts and disbursements. The company tries to keep less cash in the storefront account and more cash in the operating account to earn more interest. The company has not had a significant purchase in the past year, so the overall cash balance has significantly increased. The company plans to purchase some new cooking equipment in the next year to expand the business and take on some new accounts. In addition, the company has paid down some debt. 2 - We discussed the lower AR balance from prior year with Lisa Thomas, Corporate Sales Representative. She noted that the company has seen a slight decline in Corporate Sales primarily due to having two customers reducing their purchases in 20x2. These two customers are Luigi's Bistro and Mountain Lion Restaurant. In addition, the Company has made new efforts to collect from its customers in a timelier manner. If a customer does not pay in 30 days, Alpine calls the customer weekly to discuss and requests payment as soon as possible. 3- We discussed changes in Accounts Payable with Lindsay McKenna. She noted that the company experienced a slight dip in purchase prices and the amount of purchases in Q1 20x2 in all of the vendors' accounts except for Mountain Dairy Company. The company expects sales to increase in Q2, so that payables will be in line with previous year activity with vendors. Milk prices have been increasing, so there is a concern that the cost of production will go up with milk and potentially sugar costs throughout 20x2. In addition, Lindsay stated that this change in the account is immaterial to the company's financial statements and is a reasonable fluctuation in this type of business. 4- Per discussion with Miguel Lopez, the company paid the income tax payable amount of $38,125.96 from 04 in 20x1 on January 14, 20x2. The new balance of $21,247.78 relates to the first quarter 20x2 income tax expense. pays its taxes on quarterly basis. The ceremony informe de payable was part in the first quarter 20xz on April 24, 20x2 to Wasatch Range Trust. The company pays the dividends on an annual basis. Performed by: B. Company SDM 10/1/20X2 Preliminary Analytical Procedures-Quarterly Income Statements Reviewed by: Audit Year December 31, 20X2 TKJ 10/9/20X2 % Change 1 1 1 B.1.2 3 Months 3 Months Ended Ended 03/31/20x2 03/31/20x1 $ Change Revenue Sales Revenue: Corporate Accounts $353,739.57 $343,050.56 (10,689.01) Sales Revenues: Storefront 80,649.00 91,411.50 (10,762.50) Total Sales Revenue 434,388.57 434,462.06 (73.49) Cost of Goods Sold: Ingredients 66,736.39 64,645.64 2,090.75 Cost of Goods Sold: Boxes and Cupcake Cups 3,875.55 3,755.55 120.00 Cost of Goods Sold: Beverages 5,466.50 5,681.50 (215.00) Total COGS 76,078.44 74,082.69 1,995.75 Gross Profit 358,310.13 360,379.37 Interest Revenue 89.00 65.00 24.00 Gross Profit Plus Interest Revenue 358,399.13 360,444.37 -3.12% -11.77% -0.01% 3.23% 3.20% -3.78% 2.69% 36.92% Expenses Wage Expense Wage Tax Expense Medical Insurance Expense Auto Insurance Expense Interest Expense Electrical & Gas Service Expense Liability Insurance Expense Telecommunications Expense Cell Phone Service Expense Postage Expense Professional Services Expense Maintenance Expense Office Supplies Expense Dry Cleaning Expense Storefront Paper Supplies Expense Rental Expense Waste Services Expense 216,719.00 217,791.00 (1,072.00) 17,971.24 18,077.94 (106.70) 8,100.00 17,100.00 (9,000.00) 1,035.00 1,035.00 0.00 3,996.90 4,197.69 (200.79) 1,523.20 1,708.00 (184.80) 3,768.40 3,693.60 74.80 472.50 462.00 10.50 912.00 933.00 (21.00) 139.50 135.90 3.60 2,070.00 2,122.50 (52.50) 1,212.00 1,132.00 80.00 8,050.00 7,342.00 708.00 398.75 416.15 (17.40) 778.25 869.00 (90.75) 4,752.00 4,752.00 0.00 150.00 150.00 0.00 -0.49% -0.59% -52.63% 0.00% -4.78% -10.82% 2.03% 2.27% -2.25% 2.65% -2.47% 7.07% 9.64% -4.18% -10.44% 0.00% 0.00% Performed by: B. Company SDM 10/1/20X2 Preliminary Analytical Procedures - Quarterly income Statements Reviewed by: Audit Year December 31, 20X2 TKJ 10/9/20X2 B.1.2 3 Months 3 Months Ended Ended 03/31/20x2 03/31/20x1 Change % Change Expenses (continued) Car Maintenance and Fuel Expense Repair Expense Water Expense Soda Machine Repair and CO2 Expense Credit Card Expense Cooking Supplies Expense Banking Fees Selling and Administrative Expenses Depreciation Expense: Equipment Depreciation Expense: Plant & Property Total Depreciation Expense Total Expenses 995.38 372.50 378.75 1,156.00 878.31 12,704.00 445.00 288,978.68 3,627.00 3,300.00 6,927.00 295,905.68 1,026.78 381.25 373.75 1,128.00 897.89 11,858.00 445.00 298,028.45 4,152.00 -3,300.00 7,452.00 305,480.45 (31.40) (8.75) 5.00 28.00 (19.58) 846.00 0.00 -3.06% -2.30% 1.34% 2.48% -2.18% 7.13% 0.00% (525.00) 0.00 -12.64% 0.00% arnings Before Income tax 62,493.45 54,963.92 Income Tax Expense 21,247.78 18,683.66 2,564.12 13.72% Net Income $83,741.23 $73,647.58 F Auditor Notes: -The fluctuation is less than TM ($13.700) and less than a 10% change. F-Footed 1 - The Company has seen decreases in both their corporate and storefront sales. The Company has experienced a decrease in birthday party and holiday orders leading to the decline in storefront sales, Most customers order these items a week before the event and pick them up in the store. The decrease in corporate accounts revenue is primarily due to two customers, Luigi's Bistro and Steinberg Delis. The Company expects corporate sales to pick up through the rest of the year. 2- We discussed the change in the medical insurance expense account with Lindsay McKenna. Lindsay said the increase in medical insurance expense from prior year is due to accidentally paying $3,000 more on each check that was written to Blue Cross Blue Shield in Q1 of 20X1. The Company received a refund of $9,000 from the medical insurance company in April 20X1 due to the mistakes in payments. B Company Preliminary Analytical Procedures Ratio Analysis Audit Year December 31, 20X2 Performed by: SDM 10/1/20X2 Reviewed by: TKT 10/9/20X2 Current Ratio ** Quick Ratio** Receivables Turnover Days Outstanding in Receivables Inventory Turnover Days of Inventory on Hand Gross Profit Percentage Profit Margin Return on Assets Return on Equity Debt to Assets Debt to Equity Company Ratios 3/31/20X2 3/31/20X1 % Change 11.360 7.094 60.1% 1, 10.875 6,696 62.4% 1 2.879 2.150 33.9% 2, 126.760 169.745 .-25.3% 2, 2.540 2.506 1.4% V, 143.710 145.654 -1.3% VA 4.710 4.865 -3.2% V, 0.095 0.084 13.1% 3. 0.036 0.036 0.0% V. 0.053 0.060 -11.7% 4 0.274 0.330 -17.0% 5 0.400 0.540 -25.9% 5. Industry Ratios March 20X2 Max Avg 5.55 4.50 2.97 Avg 5.70 4.54 13.76 O 12.45 4.41 333.76 4.15 Current Ratio Quick Ratio Receivables Turnover Days Outstanding in Receivables Inventory Turnover Days of Inventory on Hand Gross Profit Percentage Profit Margin Return on Assets Return on Equity Debt to Assets Debt to Equity 150.08 1.62 441.54 0.31 0.02 0.01 Min 1.05 0.77 1.28 64.30 0.24 92.29 0.01 -0.09 -0.03 -0.04 0.00 -0.05 Max 15.30 14.00 5.68 285.43 3.95 23 1525.44 0.49 0.10 0.04 0.23 0.74 1.76 2.66 159.54 1.51 458.39 0.33 0.11 0.04 0.08 March 20X1 Min 2.02 1.06 1.09 82.83 0.20 87.88 0.10 -0.09 -0.02 -0.16 0.00 0.00 1830.71 0.48 1.02 0.29 0.67 0.55 3.99 0.04 0.21 0.26 0.19 0.58 Auditor Notes: ** Calculation includes current portion of mortgage payable and notes payable based on client's amortization schedule. On 3/31/20X2, the current portions of the mortgage and notes payables are $6,555.19 and $8,337.88, respectively. On 3/31/20X1, the current portions of the mortgage and notes payables are $6,236.12 and $9,103-75, respectively. 7 - Fluctuation meets expectations of being less than a 10% change. 4 - The 20X2 ratio is within the expected range (between the min and max) of the industry data. ATA Audit Workpaper B.3.3: pg. 1 of 2 B Company Preliminary Analytical Procedures Ratio Analysis Audit Year December 31, 20X2 Performed by: SDM 10/1/20X2 Reviewed by: TKJ 10/9/20X2 Auditor Notes (continued) Ratio Calculations Short-term (ST) Liquidity Ratios: Ability to Meet ST Obligations Current Ratio = Current Assets + Current Liabilities Quick Ratio = (Current Assets - Inventories) + Current Liabilities Activity Ratios: How Effectively Assets Are Managed Receivables Turnover = Credit Sales + Receivables Days Receivables Outstanding = 365 + Receivables Turnover Inventory Turnover = COGS + Inventory Days Inventory on Hand = 365 + Inventory Turnover Profitability Ratios Gross Profit Percentage = (Sales - COGS) + Sales Profit Margin = Net Income + Net Sales Return on Assets - Net Income + Total Assets Return on Equity = Net Income + Total Stockholder's Equity Coverage Ratio: Long-Term Solvency (Ability of Entity to Continue as a Going Concern) Debt to Assets = (ST Debt + LT Debt) + Total Assets Debt to Equity = (ST Debt + LT Debt) + Stockholders' Equity 1- The current ratio and quick ratios increased significantly primarily due to an increase in corporate cash of 236,658 (293,728 - 57,070) (B.1.1] from 3/31/20X1 to 3/31/20X2. As noted in our balance sheet analysis (B.2.1), Miguel Lopez says cash fluctuates drastically depending on the timing of cash receipts and purchases. The company has not made any major purchases in the past year, but plans to make some purchases in 20x3. In addition, the current liabilities in 20x2 have decreased from 3/31/20X1 primarily due to the timing of paying accounts payable balances and the timing of purchases. 2- The Company is collecting its receivables more quickly than it has in prior years. Per our discussion with Lisa Thomas, the Company is taking additional steps to have customers pay in a more timely manner by improving customer relationships and calling customers weekly when the customers have past due balances, 3 - The Company's profit margin has increased since prior year due to increases in storefront sales and decreases in the Company's selling and administrative expenses. Per discussion with Miguel Lopez, the Company has seen great growth and has performed well in relation to the industry competitors, largely because the company has built its reputation for quality and has maintained good relationships with vendors to keep costs down. 4-The company's ROE is significantly lower than prior year. We have requested a time to meet with Miguel Lopez to discuss the difference in this ratio in comparison to our expectations, 5-The company's debt to assets and debt to equity ratios have decreased from prior year due to the decrease in the long-term liabilities, along with the decreases in current accounts payable (due to timing of purchases and payments of liabilities). ARA Audit Workpaper B.3.3: pg. 2 of 2 51 Cambridge Business Publishers B company 20x2 Cupcake Corporate Sales Analysis Audit Year December 31, 20X2 Customer Name Bon Appetito Restaurants Boulder Tea House Broken Eggs Restaurant Brown's Tavern Bubba's Fish House Buckhead Restaurants Chavez Cantina Country Barrel Restaurants Denver Bakery Cafe Denver Sirloin Restaurants Elkhorn Coffee Shops Fontana Catering & Caf Granny's Caf High Country Coffee Julie's Wraps Little's Grill Digi's Bistro Mile High Steakhouses Mountain Lion Restaurant Mountain Trout Fish House Nora's Caf Papa's Restaurant Pebbles Inn Scotty's Taverns Smokey's Barbeque Pit Southside Cafe 'St. Francis Hotel and Spa Steinberg Delis The Breakfast Place The Sandwich Place UC Boulder Food Service UC Denver Food Service Cupcake Sales Revenue Shipping Revenue Corporate Sales Revenue 20X1 20x1 Cupcakes Ordered Invoice Total 59,493 142,783.20 5,095 12,228.00 7,052 16,924.80 5,694 13,665.60 9,622 23,092.80 13,057 31,336.80 14,021 33,650.40 35,419 85,005.60 22,809 54,741.60 19,529 46,869.60 31,674 76,017.60 15,210 36,504.00 13,766 33,038.40 23,850 57,240.00 7,602 18,244.80 5,608 13,459.20 8,396 20,150.40 44,794 107,505.60 10,235 24,564.00 11,391 27,338.40 17,922 43,012.80 12,677 30,424.80 4,310 10,344.00 6,079 14,589,60 14,105 33,852.00 9,304 22,329.60 13,449 32,277.60 10,752 25,804.80 18,984 45,561.60 4,474 10,737.60 58,948 141,475.20 44,305 106,332.00 579,626 1,391, 102.40 9,657.52 423.2 1,400,759.92 7 20x2 20x2 Cupcakes Ordered Invoice Total 62,088 149,011.20 4,464 10,713.60 7,150 17,160.00 4,225 10,140.00 10,485 25,164.00 15,013 36,031.20 15,842 38,020.80 35,163 84,391.20 24,259 58,221.60 18,578 44,587.20 34,449 82,677.60 16,067 38,560.80 13,994 33,585.60 27,365 65,676.00 10,613 25,471.20 6,218 14,923.20 6,683 16,039.20 45,629 109,509.60 10,429 25,029.60 12,269 29,445.60 20,005 48,012.00 13,496 32,390.40 3,520 8,448.00 6,288 15,091.20 17,530 42,072.00 9,364 22,473.60 15,700 37,680.00 9,265 22,236.00 20,544 49,305.60 5,287 12,688.80 58,118 139,483.20 46,633 111,919.20 606,733 1,456,159.20 10,106.88 AR.3.2 1,466,266.08 Performed by: 7ES 08/10/2013 Reviewed by: SDM 2/12/20x3 Change $ Change Cupcakes Invoice Ordered Total 2,595 6,228.00 (631) (1,514.40) 98 235.20 (1,469) (3,525.60) 863 2,071.20 1,956 4,694.40 1,821 4,370.40 (256) (614.40) 1,450 3,480.00 (951) (2,282.40) 2,775 6,660.00! 857 2,056.80 228 547.20 3,515 8,436.001 3,011 7,226.40 610 1,464.00 (1,713) (4,111.20) 835 2,004.00 194 465.60 878 2,107.20 2,083 4,999.20 819 1,965.60 (790) (1,896.00) 209 501.60 3,425 8,220.00 1 60 144.00 2,251 5,402.40 (1,487) (3,568.80) 1,560 3,744.00 813 1,951.20 (830) (1,992.00) 2,328 5,587.20 Aet Audit workspaper AR.3.3: pg. 1 of 2 133 Cambridge Business Publishers Performed by: B company 7ES 08/10/2013 20x2 Cupcake Corporate sales Analysis Audit Year December 31, 20x2 Reviewed by: SDM 2/12/20x3 Auditor Hates 78 - Agreed to Decomder Trial Balance. P Agreed to Py workeakers.
Step by Step Solution
There are 3 Steps involved in it

Get step-by-step solutions from verified subject matter experts