

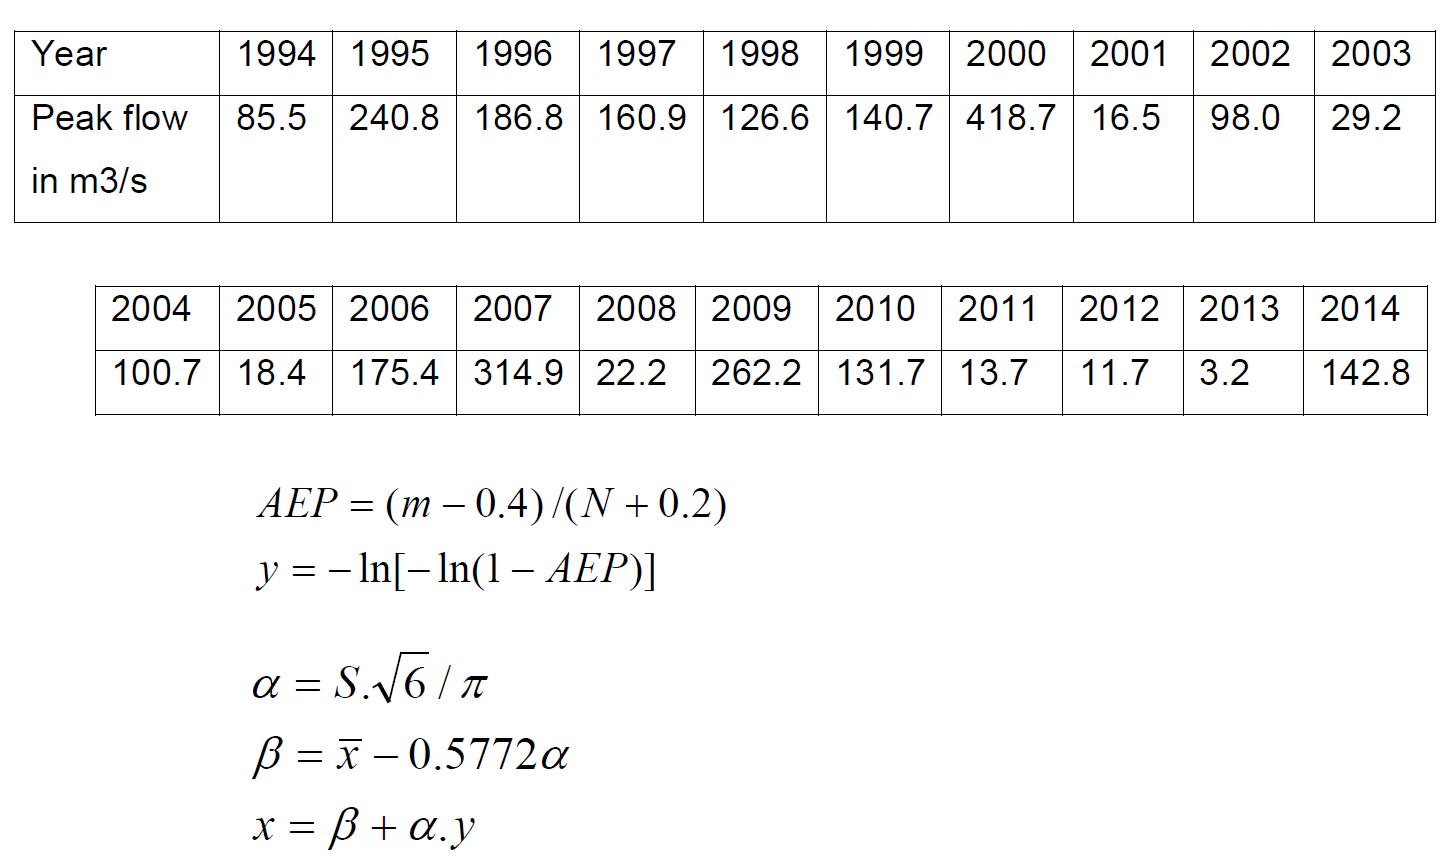
Assuming that the following flood data follows a Gumbel distribution, plot the data on a Gumbel probability
Fantastic news! We've Found the answer you've been seeking!
Question:
Assuming that the following flood data follows a Gumbel distribution, plot the data on a Gumbel probability scale (Flood magnitude Vs Reduced Variate, y) and fit a linear trend to your plot. Determine the Flood magnitude of ARI (return period) equal to 75 years from your fitted linear trend and compare with that from the equation;
Expert Answer:
Solution Illustrate the Rank AEP and the value of x as in Table 1 Year 2000 2007 2009 1995 1996 2006 ... View the full answer

Related Book For 

Mathematical Statistics with Applications in R
ISBN: 978-0124171138
2nd edition
Authors: Chris P. Tsokos, K.M. Ramachandran
Posted Date:
