

Question: Assuming that the modeling process produced a model with adequate statistical performance, would this help the marketing management of the appliance retailer? If not, why
Assuming that the modeling process produced a model with adequate statistical performance, would this help the marketing management of the appliance retailer? If not, why not? If so, how?
A home appliance retailer wants to forecast sales in various territories served by its stores. Their brilliant MBA marketing analyst collects data on several variables and decides to develop a regression model. The models dependent variable is refrigerator shipments for each store. The independent variables are: (1) area rental vacancy rates, (2) area population growth, (3) number of residential building permits issued in area, (4) median household income in area, (5) median age in area, and (6) area unemployment rate. Selected output for the full regression model is shown below.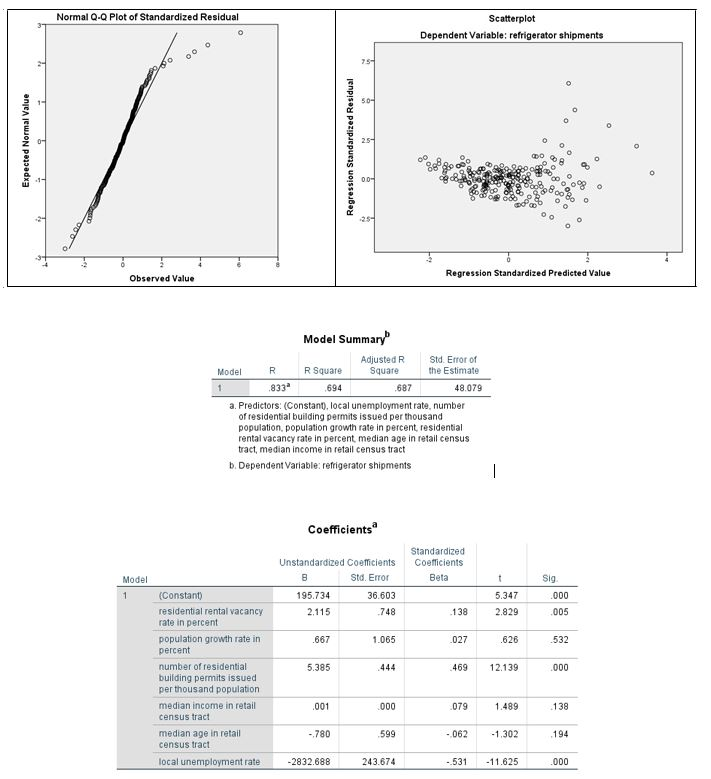
Normal Q-Q Plot of Standardized Residual Scatterplot Dependent Variable: refrigerator shipments O 00 25 50- Expected Normal Value 5- Regression Standardized Residual O 00 254 + Regression Standardized Predicted Value Observed Value Model Summary Adjusted R Std. Error of Model R R Square Square the Estimate .833" 694 .687 48.079 a. Predictors: (Constant), local unemployment rate, number of residential building permits issued per thousand population, population growth rate in percent residential rental vacancy rate in percent median age in retail census tract, median income in retail census tract b. Dependent Variable: refrigerator shipments Coefficients Unstandardized Coefficients B Sta. Error Standardized Coefficients Beta Model 1 36.603 5.347 195.734 2.115 Sig .000 005 -748 138 2.829 667 1.065 027 .626 -532 5.385 444 469 12.139 .000 (Constant) residential rental vacancy rate in percent population growth rate in percent number of residential building permits issued per thousand population median income in retail census tract median age in retail census tract local unemployment rate 001 000 .079 1.489 138 - 780 599 -062 -1.302 .194 -2832.688 243.674 - 531 -11.625 .000 Normal Q-Q Plot of Standardized Residual Scatterplot Dependent Variable: refrigerator shipments O 00 25 50- Expected Normal Value 5- Regression Standardized Residual O 00 254 + Regression Standardized Predicted Value Observed Value Model Summary Adjusted R Std. Error of Model R R Square Square the Estimate .833" 694 .687 48.079 a. Predictors: (Constant), local unemployment rate, number of residential building permits issued per thousand population, population growth rate in percent residential rental vacancy rate in percent median age in retail census tract, median income in retail census tract b. Dependent Variable: refrigerator shipments Coefficients Unstandardized Coefficients B Sta. Error Standardized Coefficients Beta Model 1 36.603 5.347 195.734 2.115 Sig .000 005 -748 138 2.829 667 1.065 027 .626 -532 5.385 444 469 12.139 .000 (Constant) residential rental vacancy rate in percent population growth rate in percent number of residential building permits issued per thousand population median income in retail census tract median age in retail census tract local unemployment rate 001 000 .079 1.489 138 - 780 599 -062 -1.302 .194 -2832.688 243.674 - 531 -11.625 .000
Step by Step Solution
There are 3 Steps involved in it

Get step-by-step solutions from verified subject matter experts