

Question: Assuming that the population is normallydistributed, construct a 99 99 % confidence interval for the population mean for each of the sets of data below.
Assuming that the population is normallydistributed, construct a 99
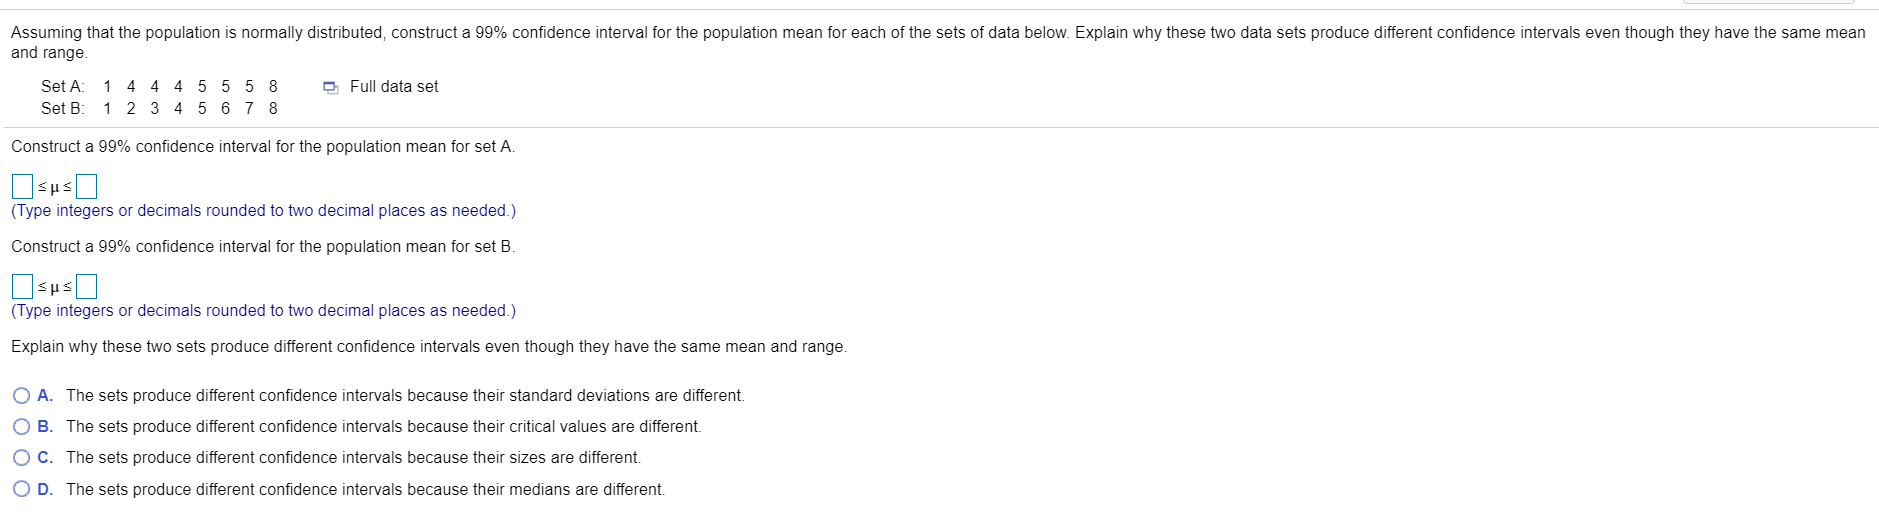
99% confidence interval for the population mean for each of the sets of data below. Explain why these two data sets produce different confidence intervals even though they have the same mean and range.
SetA: 1 4 4 4 5 5 5 8
SET B: 1 2 3 4 5 6 7 8
Construct a 99% confidence interval for the population mean for set A.
(...) (...) (Type integers or decimals rounded to two decimal places asneeded.)
Construct a 99% confidence interval for the population mean for set B.
(...) (...) (Type integers or decimals rounded to two decimal places asneeded.)
Explain why these two sets produce different confidence intervals even though they have the same mean and range.
A. The sets produce different confidence intervals because their standard deviations are different.
B. The sets produce different confidence intervals because their critical values are different.
C. The sets produce different confidence intervals because their sizes are different.
D. The sets produce different confidence intervals because their medians are different.
\f
Step by Step Solution
There are 3 Steps involved in it

Get step-by-step solutions from verified subject matter experts